


CDC Features - Isolates Reported to PulseNet USA, 1996-2012
 ShareCompartir
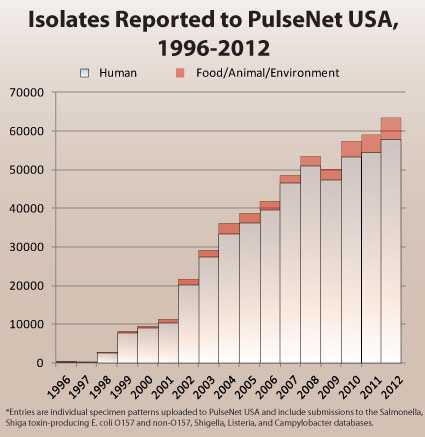
Isolates Reported to PulseNet USA; 1996-2010
Catagorized by Year, Human Isolates; Non-Human Isolates and Total Isolates.
1996: 254; 5; 259.
1997: 146; 3; 149.
1998: 2,615; 92; 2707.
1999: 7,726; 527; 8,253.
2000: 9,082; 485; 9,567.
2001: 10,422; 996; 1,1418.
2002: 20,342; 1578; 2,1920.
2003: 27,393; 2035; 2,9428.
2004: 33,538; 2712; 3,6250.
2005: 36,379; 2612; 3,8991.
2006: 39,754; 2246; 42,000.
2007: 46,612; 2182; 48,794.
2008: 51,103; 2566; 53,669.
2009: 47,479; 2872; 50,351.
2010: 53,399; 4163; 57,562.
2011: 55,690; 4544; 60,234.
2012: 58,799; 4337; 63,136.
- Page last reviewed: February 24, 2012
- Page last updated: February 24, 2012
- Content source: