

Prescribing Data
 ShareCompartir
Updated Data Available
Please note: A recent CDC Surveillance Summary contains updated data. To view the report, please visit the Annual Surveillance Report of Drug-Related Risks and Outcomes, United States, 2017 [PDF – 1 MB].
Sales of prescription opioids in the U.S. nearly quadrupled from 1999 to 2014,1 but there has not been an overall change in the amount of pain Americans report.2,3 During this time period, prescription opioid overdose deaths increased similarly.
The supply of prescription opioids remains high in the U.S.4 An estimated 1 out of 5 patients with non-cancer pain or pain-related diagnoses are prescribed opioids in office-based settings.3 From 2007 – 2012, the rate of opioid prescribing has steadily increased among specialists more likely to manage acute and chronic pain. Prescribing rates are highest among pain medicine (49%), surgery (37%), and physical medicine/rehabilitation (36%). However, primary care providers account for about half of opioid pain relievers dispensed. 3
Health care providers, including those in primary care settings, report concern about opioid-related risks of addiction and overdose, as well as insufficient training in pain management. Although prescription opioids can help manage some types of pain, there is not enough evidence that opioids improve chronic pain, function, and quality of life. Moreover, long-term use of opioid pain relievers for chronic pain can be associated with abuse and overdose, particularly at higher dosages.
Prescription Opioid Use Among Subgroups
Prescription opioid use varies according to age, gender, and ethnicity:
- Older adults (aged 40 years and older) are more likely to use prescription opioids than adults aged 20 – 39.
- Women are more likely to use prescription opioids than men.
- Non-Hispanic whites are more likely to use prescription opioids than Hispanics. There are no significant differences in prescription opioid use between non-Hispanic whites and non-Hispanic blacks.5,6
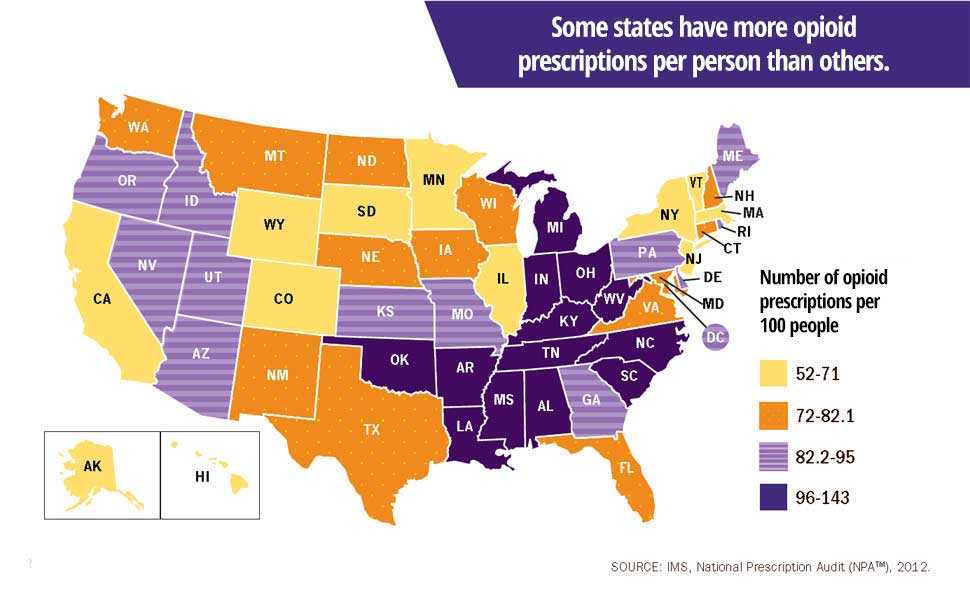
State-to-State Variability
Prescribing rates for opioids vary widely across different states. In 2012, health care providers in the highest-prescribing state wrote almost 3 times as many opioid prescriptions per person as those in the lowest prescribing state.4 Health issues that cause people pain do not vary much from place to place, and do not explain this variability in prescribing. Some other factors that may influence prescribing rates include:
Sources of Prescription Opioids
Most people who abuse prescription opioids get them for free from a friend or relative. However, those who are at highest risk of overdose (using prescription opioids nonmedically 200 or more days a year) get them in ways that are different from those who use them less frequently. These people get opioids using their own prescriptions (27 percent), from friends or relatives for free (26 percent), buying from friends or relatives (23 percent), or buying from a drug dealer (15 percent). Those at highest risk of overdose are about four times more likely than the average user to buy the drugs from a dealer or other stranger.3
![Source of Opioid Pain Reliever Most Recently Used by Frequency of Past-Year Nonmedical Use[a]](../images/data/source-and-frequency-graph.png)
Additional Data Sources
-
WONDERCDC’s WONDER (Wide-ranging Online Data for Epidemiologic Research) an easy-to-use, menu-driven system that makes the information resources of the Centers for Disease Control and Prevention (CDC) available to public health professionals and the public at large. It provides access to a wide array of public health information.
-
WISQARSCDC’s WISQARS™ (Web-based Injury Statistics Query and Reporting System) is an interactive, online database that provides fatal and nonfatal injury, violent death, and cost of injury data from a variety of trusted sources.
-
CDC Data & StatisticsThis web site features interactive tools, surveys, publications, databases, and more.
-
CMS Medicare Part D Opioid Drug Mapping Tool Interactive mapping tool that shows geographic comparisons, at the state, county, and local levels, of de-identified Medicare Part D opioid prescription prescriptions written and submitted to be filled within the United States.
References
- Centers for Disease Control and Prevention. Vital Signs: Overdoses of Prescription Opioid Pain Relievers — United States, 1999—2008. MMWR 2011; 60(43);1487-1492.
- Chang H, Daubresse M, Kruszewski S, et al. Prevalence and treatment of pain in emergency departments in the United States, 2000 – 2010. Amer J of Emergency Med 2014; 32(5): 421-31.
- Daubresse M, Chang H, Yu Y, Viswanathan S, et al. Ambulatory diagnosis and treatment of nonmalignant pain in the United States, 2000 – 2010. Medical Care 2013; 51(10): 870-878. http://dx.doi.org/10.1097/MLR.0b013e3182a95d86
- Centers for Disease Control and Prevention. Vital Signs: Variation Among States in Prescribing of Opioid Pain Relievers and Benzodiazepines — United States, 2012. MMWR 2014; 63(26):563-568.
- Frenk SM, Porter KS, and Paulozzi LJ. Prescription Opioid Analgesic Use Among Adults: United States, 1999 – 2012., National Center for Health Statistics Data Brief, February 2015.
- Paulozzi LJ, Strickler GK, Kreiner PW, and Koris CM. Controlled Substance Prescribing Patterns – Prescription Behavior Surveillance System, Eight States, 2013. MMWR Surveill Summ 2015;64(8):1-14.

- Page last reviewed: August 30, 2017
- Page last updated: August 30, 2017
- Content source:
- Centers for Disease Control and Prevention,
- National Center for Injury Prevention and Control,
- Division of Unintentional Injury Prevention