

National Immunization Survey (NIS)
 ShareCompartir
On This Page
Breastfeeding Among U.S. Children Born 2002–2014, CDC National Immunization Survey
Percentage of U.S. Children Who Were Breastfed, by Birth Yeara,b


aBreastfeeding rates through 2008 births are based on the National Immunization Survey’s landline sampling frame. Starting with 2009 births, rates are based on a dual-frame sample that includes respondents surveyed on landline or cellular telephones. See survey methods for details on study design and the impact of adding a sample of cellular telephone respondents to the National Immunization Survey starting in 2011.
bData from the U.S. territories are excluded from the national breastfeeding estimates to be consistent with the analytical methods for the establishment of Healthy People 2020 targets on breastfeeding. Healthy People 2020 targets for breastfeeding objectives in the early postpartum period (i.e., ever breastfed), at 6 months and 12 months and exclusive breastfeeding through 3 and 6 months are available at https://www.healthypeople.gov/2020/topics-objectives/topic/maternal-infant-and-child-health/objectives.
cNational data on exclusive breastfeeding are not available for children born before 2003. See survey methods for details.
| Percentage of U.S. Children Who Were Breastfed, by Birth Year, National Immunization Survey, United States (Percentage ± half 95% Confidence Interval)a,b | ||||||||||||||
|---|---|---|---|---|---|---|---|---|---|---|---|---|---|---|
| Landline Sample | Dual-frame Sample | |||||||||||||
| 2002 | 2003 | 2004 | 2005 | 2006 | 2007 | 2008 | 2009 | 2010 | 2011 | 2012 | 2013 | 2014 | ||
| Ever Breastfed | 71.4±0.9 | 72.6±0.9 | 73.1±0.8 | 74.1±1.0 | 74.0±0.9 | 75.0±0.9 | 74.6±0.9 | 76.1±1.0 | 76.7±1.2 | 79.2±1.2 | 80.0±1.2 | 81.1±1.1 | 82.5±1.1 | |
| At 6 months | 37.9±1.0 | 39.1±0.9 | 42.1±0.9 | 42.9±1.1 | 43.5±1.1 | 43.8±1.1 | 44.4±1.1 | 46.6±1.2 | 47.5±1.4 | 49.4±1.5 | 51.4±1.5 | 51.8±1.4 | 55.3±1.4 | |
| At 12 months | 19.2±0.8 | 19.6±0.8 | 21.4±0.8 | 21.5±0.9 | 22.7±0.9 | 22.7±1.0 | 23.4±1.0 | 24.6±1.0 | 25.3±1.3 | 26.7±1.3 | 29.2±1.4 | 30.7±1.3 | 33.7±1.3 | |
| Exclusively through 3 moths | 29.6±1.5 | 31.5±0.9 | 32.1±1.0 | 33.6±1.0 | 33.5±1.0 | 34.3±1.0 | 35.9±1.1 | 37.1±1.4 | 40.7±1.5 | 43.3±1.6 | 44.4±1.4 | 46.6±1.4 | ||
| Exclusively through 6 months | 10.3±1.0 | 12.1±0.7 | 12.3±0.7 | 14.1±0.8 | 13.8±0.8 | 14.6±0.8 | 15.6±0.9 | 17.2±1.2 | 18.8±1.2 | 21.9±1.4 | 22.3±1.1 | 24.9±1.3 | ||
|
aBreastfeeding rates through 2008 births are based on the National Immunization Survey’s landline sampling frame. Starting with 2009 births, rates are based on a dual-frame sample that includes respondents surveyed on landline or cellular telephones. See survey methods for details on study design and the impact of adding a sample of cellular telephone respondents to the National Immunization Survey starting in 2011. bData from the U.S. territories are excluded from the national breastfeeding estimates to be consistent with the analytical methods for the establishment of Healthy People 2020 targets on breastfeeding. |
||||||||||||||
Percentage of Breastfed Children Who Were Supplemented with Infant Formula, by Birth Year, National Immunization Survey, United Statesa,b,c
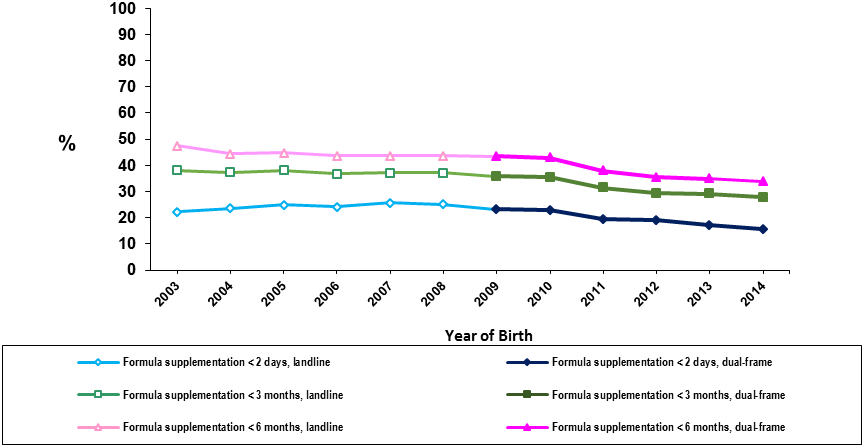
aFormula supplementation rates through 2008 births are based on the National Immunization Survey’s landline sampling frame. Starting with 2009 births, rates are based on a dual-frame sample that includes respondents surveyed on landline or cellular telephones. See survey methods for details on study design and the impact of adding a sample of cellular telephone respondents to the National Immunization Survey starting in 2011.
bFormula supplementation is defined as supplementation of breast milk with formula (with or without other supplementary liquids or solids) among infants breastfed at the age specified (2 days, 3 months, or 6 months). Data from the U.S. territories are excluded from the national estimates to be consistent with the analytical methods for the establishment of Healthy People 2020 targets on breastfeeding.
cNational data on formula supplementation are not available for children born before to 2003. See survey methods for details on study design.
| Percentage of U.S. Breastfed Infants Who Were Supplemented with Infant Formula, by Birth Year, National Immunization Survey, United States (Percentage +/- half 95% Confidence Interval)a,b,c | ||||||||||||||||
|---|---|---|---|---|---|---|---|---|---|---|---|---|---|---|---|---|
| Landline Sample | Dual-frame Sample | |||||||||||||||
| 2003 | 2004 | 2005 | 2006 | 2007 | 2008 | 2009 | 2010 | 2011 | 2012 | 2013 | 2014 | |||||
| Before 2 days | 22.3±1.6 | 23.5±1.0 | 24.9±1.1 | 24.2±1.1 | 25.6±1.2 | 25.1±1.2 | 23.3±1.1 | 22.8±1.4 | 19.4±1.3 | 19.1±1.3 | 17.1±1.2 | 15.5±1.0 | ||||
| Before 3 months | 38.1±2.2 | 37.4±1.3 | 38.1±1.4 | 36.7±1.4 | 37.1±1.5 | 37.1±1.5 | 35.9±1.5 | 35.4±1.8 | 31.5±1.8 | 29.3±1.8 | 29.2±1.6 | 27.8±1.5 | ||||
| Before 6 months | 47.4±2.6 | 44.5±1.5 | 44.8±1.7 | 43.6±1.6 | 43.7±1.7 | 43.6±1.7 | 43.4±1.7 | 42.8±2.2 | 37.9±2.0 | 35.4±2.1 | 34.9±1.8 | 33.8±1.7 | ||||
|
aFormula supplementation rates through 2008 births are based on the National Immunization Survey’s landline sampling frame. Starting with 2009 births, rates are based on a dual-frame sample that includes respondents surveyed on landline or cellular telephones. See survey methods for details on study design and the impact of adding a sample of cellular telephone respondents to the National Immunization Survey starting in 2011. bFormula supplementation is defined as supplementation of breast milk with formula (with or without other supplementary liquids or solids) among infants breastfed at the age specified (2 days, 3 months, or 6 months). Data from the U.S. territories are excluded from the national estimates to be consistent with the analytical methods for the establishment of Healthy People 2020 targets on breastfeeding. cNational data on formula supplementation are not available for children born prior to 2003. See survey methods for details on study |
||||||||||||||||
Rates of Any and Exclusive Breastfeeding by Age Among Children Born in 2014, National Immunization Survey, United Statesa,b
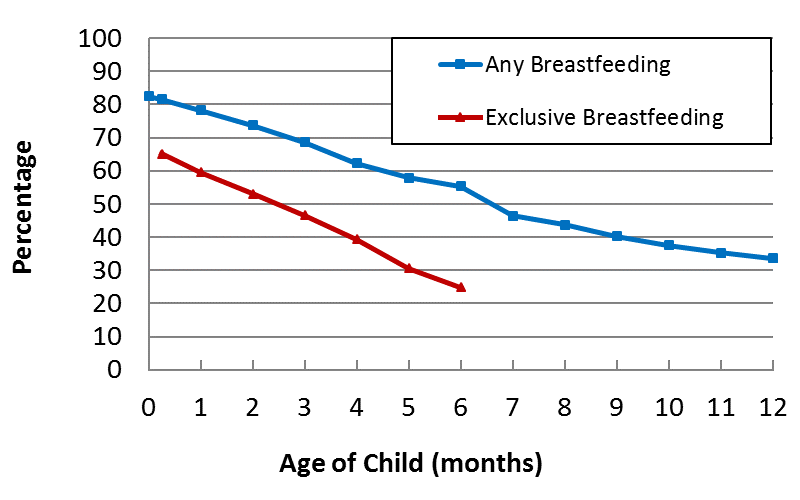
aBreastfeeding rates presented in this figure are based on dual-frame (landline and cellular telephone) samples from 2015 and 2016 National Immunization Surveys. See survey methods for details on study design.
bExclusive breastfeeding is defined as ONLY breast milk — NO solids, water, or other liquids. Data from the U.S. territories are excluded from the national estimates to be consistent with the analytical methods for the establishment of Healthy People 2020 targets on breastfeeding.
| Rates of Any and Exclusive Breastfeeding by Age Among Children Born in 2014 (Percentage +/- half 95% Confidence Interval)a,b U.S. National Breastfeeding Rates, 2014 Births |
||
|---|---|---|
| Child Age | Breastfeeding (n=17109) |
Exclusive Breastfeeding (n=16522) |
| At birth | 82.5±1.1 | |
| 7 days | 81.5±1.1 | 65.1±1.3 |
| 14 days | 80.6±1.1 | 63.0±1.4 |
| 21 days | 79.4±1.1 | 61.0±1.4 |
| 28 days | 78.4±1.2 | 59.9±1.4 |
| 42 days | 74.9±1.2 | 54.1±1.4 |
| 1 month | 78.2±1.2 | 59.6±1.4 |
| 2 month | 73.7±1.2 | 53.0±1.4 |
| 3 month | 68.6±1.3 | 46.6±1.4 |
| 4 month | 62.3±1.4 | 39.3±1.4 |
| 5 month | 57.9±1.4 | 30.6±1.4 |
| 6 month | 55.3±1.4 | 24.9±1.3 |
| 7 month | 46.4±1.4 | |
| 8 month | 43.7±1.4 | |
| 9 month | 40.3±1.4 | |
| 10 month | 37.5±1.4 | |
| 11 month | 35.3±1.3 | |
| 12 month | 33.7±1.3 | |
| 18 month | 13.5±1.0 | |
|
aBreastfeeding rates presented in this table are based on dual-frame (landline and cellular telephone) samples from 2015 and 2016 National Immunization Surveys. See survey methods for details on study design. bExclusive breastfeeding is defined as ONLY breast milk — NO solids, water, or other liquids. Data from the U.S. territories are excluded from the national estimates to be consistent with the analytical methods for the establishment of Healthy People 2020 targets on breastfeeding. |
||
Breastfeeding Rates by State and Socio-demographics Based on Dual-frame Phone Samples Starting from 2009 Birthsa |
||||||
|---|---|---|---|---|---|---|
| “Any” and “Exclusive” Breastfeeding Rates | Birth Year | |||||
| -by States | 2014 | 2013 | 2012 | 2011 | 2010 | 2009 |
| -by Socio-demographics | 2014 | 2013 | 2012 | 2011 | 2010 | 2009 |
|
aDual-frame phone samples starting from 2009 births (2011 and 2012 NIS survey years) include both landline and cellular phone samples (see survey methods). |
||||||
Breastfeeding rates for birth years 2000–2008 based on a landline telephone sampling frame and for birth years 2009 and beyond based on a dual-frame sampling frame can be found by visiting the CDC Division of Nutrition, Physical Activity, and Obesity Data, Trends & Maps Database.
- Page last reviewed: August 1, 2017
- Page last updated: August 1, 2017
- Content source: