Report to Congress October 2004: VIII. Figures
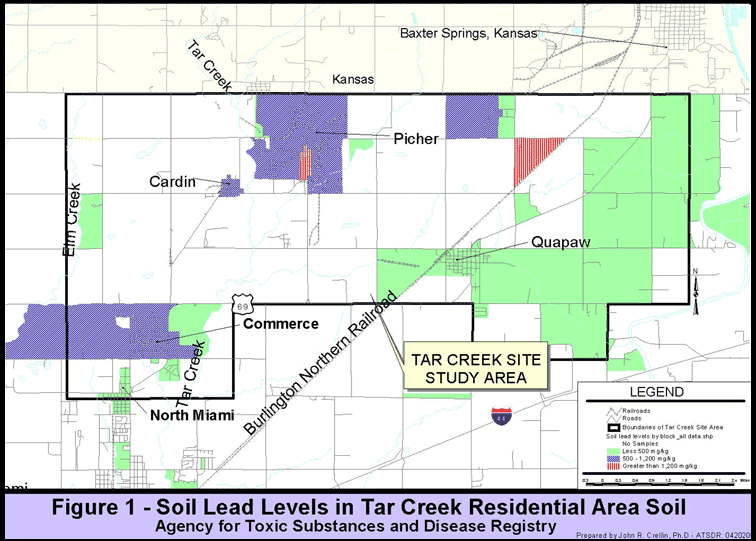
Residential area soil (i.e., residential yards, daycare centers, playgrounds, and parks) is considered a completed exposure pathway for areas identified (Figure 1) as having soil lead levels at or above 500 milligrams per kilogram (mg/kg). The main source of lead contamination in the residential area of the site is mine tailings (Ecology and Environment 1996). The tailings were transported to the residential properties as a result of deposition of airborne dust from tailings piles and ponds and use of chat as fill and for surfacing driveways.

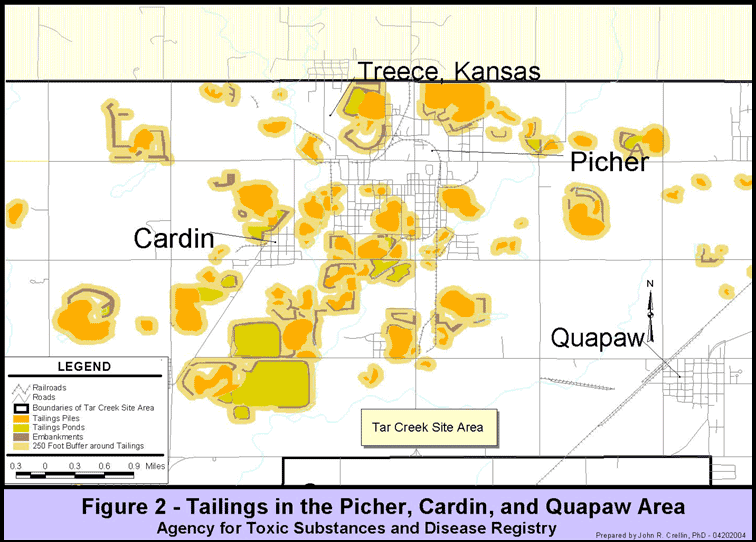
Mine tailings are a completed exposure pathway for tailings piles, ponds, and embankments identified (Figure 2). The locations where mine tailings are found in the Tar Creek Site Area were provided to ATSDR by EPA. Adults and children swallow lead-contaminated mine tailings as an incidental consequence of walking or playing on the tailings piles, ponds, or embankments. The exposure pathway for mine tailings is especially important for children who live near the tailings piles, ponds, or embankments. Hand-to-mouth behaviors of children, especially those aged at or under 6 years, can result in higher soil ingestion rates. At the site, exposure to mine tailings is especially likely in Picher and Cardin, where many homes are within 250 feet of tailings (Figure 2).

Figure 3 shows sources of child blood lead test results data for the Tar Creek Superfund site. The Ottawa County Sunshine Clinic, the Ottawa County Lead Poisoning Prevention Program (OCLPPP) managed by the Ottawa County Health Department, Tribal Efforts Against Lead (TEAL) and Community Health Action and Monitoring Program (CHAMP) surveys, Tribal Health Clinics, private physicians, and other private and public clinics collect blood from children and test for lead. This figure shows that these programs send data to the Oklahoma State Department of Health Childhood Lead Poisoning Prevention Program Surveillance System (OKCLPPSS) which then transmits aggregate data to the CDC Childhood Blood Lead Surveillance Program.

Figure 4 shows that among tested children living in the Tar Creek Superfund site aged 1 to 5 years, the percentage of blood lead level elevations have declined from 1995 to 2003. In 1996, OKCLPPSS data showed that among tested children living in the Tar Creek Superfund Site, aged 1 to 5 years: 31.2% (67/215) had blood lead elevations (≥ 10 µg/dL). In 2003, OCLPPP data showed that among tested children living in the Tar Creek Superfund Site, aged 1 to 5 years 2.8% (7/250) of tested children had elevated blood lead levels.

Figure 5 shows that of the children in Picher and Cardin that were tested for blood lead, the percentage of children with elevated blood lead levels declined from 1995 to 2003. In 1996, OKCLPPSS data showed that among tested children living in Picher and Cardin, aged 1 to 5 years: 44.6% (41/92) had blood lead elevations (≥ 10 µg/dL). In 2003, the OCLPPP data showed that among tested children living in Picher and Cardin, aged 1 to 5 years: 3.4% (3/88) had elevated blood lead levels. In 1996, the percentage of children identified with elevated blood lead levels was higher in the combined areas of Picher and Cardin than in the Superfund site as a whole. However we observed that these differences have diminished in recent years.

Figure 6 shows that among tested children living in the Tar Creek Superfund site aged 1 to 5 years, the geometric blood lead level mean has declined from 1995 to 2003. In 1996, OKCLPPSS data showed that among tested children living in the Tar Creek Superfund Site, aged 1 to 5 years: the geometric mean was 6.65 µg/dL. In 2003, OCLPPP data showed that among tested children living in the Tar Creek Superfund Site, aged 1 to 5 years, the geometric mean was 3.04 µg/dL.

Figure 7 shows that of the children in Picher and Cardin that were tested for blood lead, the geometric mean for blood lead declined from 1995 to 2003. In 1996, OKCLPPSS data showed that among tested children living in Picher and Cardin, aged 1 to 5 years: the geometric mean was 9.17 µg/dL. In 2003, the OCLPPP data showed that among tested children living in Picher and Cardin, aged 1 to 5 years: the geometric mean was 3.82 µg/dL.
In 1996, the percentage of children identified with elevated blood lead levels and the geometric means of all children tested was higher in the combined areas of Picher and Cardin than in the Superfund site as a whole. However we observed that these differences have diminished in recent years.

- Page last reviewed: September 21, 2015
- Page last updated: November 12, 2010
- Content source:


 ShareCompartir