Food pyramid (nutrition)
A food pyramid or diet pyramid is a triangular diagram representing the optimal number of servings to be eaten each day from each of the basic food groups.[1] The first pyramid was published in Sweden in 1974.[2][3][4] The 1992 pyramid introduced by the United States Department of Agriculture (USDA) was called the "Food Guide Pyramid" or "Eating Right Pyramid". It was updated in 2005 to "MyPyramid", and then it was replaced by "MyPlate" in 2011.[5][6]
Swedish origin
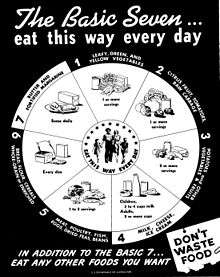
Amid high food prices in 1972, Sweden's National Board of Health and Welfare developed the idea of "basic foods" that were both cheap and nutritious, and "supplemental foods" that added nutrition missing from the basic foods. Anna-Britt Agnsäter, chief of the "test kitchen" for Kooperativa Förbundet (a cooperative Swedish retail chain), held a lecture the next year on how to illustrate these food groups. Attendee Fjalar Clemes suggested a triangle displaying basic foods at the base. Agnsäter developed the idea into the first food pyramid, which was introduced to the public in 1974 in KF's Vi magazine.[2][3][4] The pyramid was divided into basic foods at the base, including milk, cheese, margarine, bread, cereals and potato; a large section of supplemental vegetables and fruit; and an apex of supplemental meat, fish and egg. The pyramid competed with the National Board's "dietary circle," which KF saw as problematic for resembling a cake divided into seven slices, and for not indicating how much of each food should be eaten. While the Board distanced itself from the pyramid, KF continued to promote it.
Food pyramids were developed in other Scandinavian countries, as well as West Germany, Japan and Sri Lanka. The United States later developed its first food pyramid in 1992.
Food pyramid published by the WHO and FAO
The World Health Organization, in conjunction with the Food and Agriculture Organization, published guidelines that can be effectively represented in a food pyramid relating to objectives in order to prevent obesity, improper nutrition, chronic diseases and dental caries based on meta-analysis [7][8] though they represent it as a table rather than as a "pyramid". The structure is similar in some respects to the USDA food pyramid, but there are clear distinctions between types of fats, and a more dramatic distinction where carbohydrates are categorized on the basis of free sugars versus sugars in their natural form. Some food substances are singled out due to the impact on the target issues that the "pyramid" is meant to address. In a later revision, however, some recommendations are omitted as they automatically follow other recommendations while other sub-categories are added. The reports quoted here explain that where there is no stated lower limit in the table below, there is no requirement for that nutrient in the diet.

| Dietary factor | 1989 WHO Study Group recommendations | 2002 Joint WHO/FAO Expert Consultation recommendations |
|---|---|---|
| Total fat | 15–30% | 15–30% |
| Saturated fatty acids (SFAs) | 0–10% | <10% |
| Polyunsaturated fatty acids (PUFAs) | 3–7% | 6–10% |
| n-6 PUFAs | 5–8% | |
| n-3 PUFAs | 1–2% | |
| Trans fatty acids | <1% | |
| Monounsaturated fatty acids (MUFAs) | By difference | |
| Total carbohydrate | 55–75% | 55–75% |
| Free sugars | 0–10% | <10% |
| Complex carbohydrate | 50–70% | No recommendation |
| Protein | 10–15% | 10–15% |
| Cholesterol | 0–300 mg/day | < 300 mg/day |
| Sodium chloride (Sodium) | < 6 g/day | < 5 g/day (< 2 g/day) |
| Fruits and vegetables | ≥ 400 g/day | ≥ 400 g/day |
| Pulses, nuts and seeds | ≥ 30 g/day (as part of the 400 g of fruit and vegetables) | |
| Total dietary fiber | 27–40 g/day | From foods |
| NSP | 16–24 g/day | From foods |
All percentages are percentages of calories, not of weight or volume. To understand why, consider the determination of an amount of "10% free sugar" to include in a day's worth of calories. For the same amount of calories, free sugars take up less volume and weight, being refined and extracted from the competing carbohydrates in their natural form. In a similar manner, all the items are in competition for various categories of calories.
The representation as a pyramid is not precise, and involves variations due to the alternative percentages of different elements, but the main sections can be represented.
USDA food pyramid
History
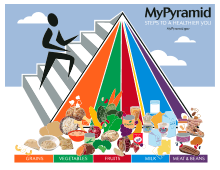
The USDA food pyramid was created in 1992 and divided into six horizontal sections containing depictions of foods from each section's food group. It was updated in 2005 with colorful vertical wedges replacing the horizontal sections and renamed MyPyramid. MyPyramid was often displayed with the food images absent, creating a more abstract design. In an effort to restructure food nutrition guidelines, the USDA rolled out its new MyPlate program in June 2011. My Plate is divided into four slightly different sized quadrants, with fruits and vegetables taking up half the space, and grains and protein making up the other half. The vegetables and grains portions are the largest of the four.
A modified food pyramid was proposed in 1999 for adults aged over 70.[10][11]
Vegetables
A vegetable is a part of a plant consumed by humans that is generally savory but is not sweet. A vegetable is not considered a grain, fruit, nut, spice, or herb. For example, the stem, root, flower, etc., may be eaten as vegetables. Vegetables contain many vitamins and minerals; however, different vegetables contain different spreads, so it is important to eat a wide variety of types. For example, green vegetables typically contain vitamin A, dark orange and dark green vegetables contain vitamin C, and vegetables like broccoli and related plants contain iron and calcium. Vegetables are very low in fats and calories, but ingredients added in preparation can often add these.
Grains
These foods provide complex carbohydrates, which are a good source of energy but provide little nutrition. While they may serve as a filler in low-fat meal plans, replacing these with nuts and seeds would be a better option. Examples include corn, wheat, pasta, and rice.
Fruits
In terms of food (rather than botany), fruits are the sweet-tasting seed-bearing parts of plants, or occasionally sweet parts of plants which do not bear seeds. These include apples, oranges, grapes, bananas, etc. Fruits are low in calories and fat and are a source of natural sugars, fiber and vitamins. Processing fruit when canning or making into juices may add sugars and remove nutrients. The fruit food group is sometimes combined with the vegetable food group. Note that a massive number of different plant species produce seed pods which are considered fruits in botany, and there are a number of botanical fruits which are conventionally not considered fruits in cuisine because they lack the characteristic sweet taste, e.g., tomatoes or avocados.
Oils and sweets
A food pyramid's tip is the smallest part, so the fats and sweets in the top of the Food Pyramid should comprise the smallest percentage of the diet. The foods at the top of the food pyramid should be eaten sparingly because they provide calories, but not much in the way of nutrition. These foods include salad dressings, oils, cream, butter, margarine, sugars, soft drinks, candies, and sweet desserts.
Dairy
Dairy products are produced from the milk of mammals, usually but not exclusively cattle. They include milk, yogurt and cheese. Milk and its derivative products are a rich source of dietary calcium and also provide protein, phosphorus, vitamin A, and vitamin D. However, many dairy products are high in saturated fat and cholesterol compared to vegetables, fruits and whole grains, which is why skimmed products are available as an alternative. Historically, adults were recommended to consume three cups of dairy products per day.[12] More recently, evidence is mounting that dairy products have greater levels of negative effects on health than previously thought and confer fewer benefits. For example, recent research has shown that dairy products are not related to stronger bones or less fractures; on the flip side, another study showed that milk (and yogurt) consumption results in higher bone mineral density in the hip. Overall, the majority of research suggests that dairy has some beneficial effects on bone health, in part because of milk's other nutrients.[13][14][15]
Meat and beans
Meat is the tissue – usually muscle – of an animal consumed by humans. Since most parts of many animals are edible, there is a vast variety of meats. Meat is a major source of protein, as well as iron, zinc, and vitamin B12. Meats, poultry, and fish include beef, chicken, pork, salmon, tuna, shrimp, and eggs.
The meat group is one of the major compacted food groups in the food guide pyramid. Many of the same nutrients found in meat can also be found in foods like eggs, dry beans, and nuts, such foods are typically placed in the same category as meats, as meat alternatives. These include tofu, products that resemble meat or fish but are made with soy, eggs, and cheeses. For those who do not consume meat or animal products (see Vegetarianism, veganism and Taboo food and drink), meat analogs, tofu, beans, lentils, chick peas, nuts and other high-protein vegetables are also included in this group. The food guide pyramid suggests that adults eat 2–3 servings per day. One serving of meat is 4 oz (110 g), about the size of a deck of cards.
Controversy


Certain dietary choices that have been linked to heart disease, such as an 8 oz (230 g) serving of hamburger daily, were technically permitted under the pyramid. The pyramid also lacked differentiation within the protein-rich group ("Meat, Poultry, Fish, Dry Beans, Eggs, and Nuts").[16]
In April 1991, the U.S. Department of Agriculture (USDA) halted publication of its Eating Right Pyramid, due to objections raised by meat and dairy lobbying groups concerning the guide’s display of their products. Despite the USDA’s explanations that the guide required further research and testing, it was not until one year later—after its content was supported by additional research—that the Eating Right Pyramid was officially released. This time, even the guide’s graphic design was altered to appease industry concerns. This incident was only one of many in which the food industry attempted to alter federal dietary recommendations in their own economic self-interest.[17]
Some of the recommended quantities for the different types of food in the old pyramid have also come under criticism for lack of clarity. For instance, the pyramid recommends two to three servings from the protein-rich group, but this is intended to be a maximum. The pyramid recommends two to four fruit servings, but this is intended to be the minimum.[18]
The fats group as a whole have been put at the tip of the pyramid, under the direction to eat as little as possible, which is largely problematic. Under the guide, one would assume to avoid fats and fatty foods, which can lead to health problems. For one, fat is essential in a person's general sustainability.[19][20][21] Research suggests that unsaturated fats aid in weight loss, reduce heart disease risk,[22] lower blood sugar, and even lower cholesterol.[23][24][25] Also, they are very long sustaining, and help keep blood sugar at a steady level.[26][27] On top of that, these fats help brain function as well.[28]
Several books have claimed that food and agricultural associations exert undue political power on the USDA.[29][30] Food industries, such as milk companies, have been accused of influencing the United States Department of Agriculture into making the colored spots on the newly created food pyramid larger for their particular product. The milk section has been claimed to be the easiest to see out of the six sections of the pyramid, making individuals believe that more milk should be consumed on a daily basis compared to the others.[31] Furthermore, the inclusion of milk as a group unto itself implies that is an essential part of a healthy diet, despite the many people who are lactose intolerant or choose to abstain from dairy, and a number of cultures that have historically consumed little if any dairy products. Joel Fuhrman says in his book Eat to Live that U.S. taxpayers must contribute $20 billion on price supports to artificially reduce the price of cattle feed to benefit the dairy, beef and veal industries, and then pay the medical bills for an overweight population.[32] He asks if the USDA is under the influence of the food industry, because a food pyramid based on science would have vegetables at its foundation.[32]
These controversies prompted the creation of pyramids for specific audiences, particularly the mediterranean pyramid in 1993[33] and some Vegetarian Diet Pyramids.[34][35][36][37]
Alternatives to the USDA pyramid
The Harvard School of Public Health proposes a healthy eating pyramid, which includes calcium and multi-vitamin supplements as well as moderate amounts of alcohol, as an alternative to the Food Guide Pyramid. Many observers believe that the Harvard pyramid follows the results of nutrition studies published in peer-reviewed scientific journals more closely. But in their book Fantastic Voyage: Live Long Enough to Live Forever, published in 2004, Ray Kurzweil and Terry Grossman M.D., point out that the guidelines provided in the Harvard Pyramid fail to distinguish between healthy and unhealthy oils. In addition, whole-grain foods are given more priority than vegetables, which should not be the case, as vegetables have a lower glycemic load. Other observations are that fish should be given a higher priority due to its high omega-3 content, and that high fat dairy products should be excluded. As an alternative, the authors postulate a new food pyramid, emphasising low glycemic-load vegetables, healthy fats, such as avocados, nuts and seeds, lean animal protein, fish, and extra virgin olive oil.
The University of Michigan Integrative Medicine’s Healing Foods Pyramid emphasizes plant-based choices, variety and balance. It includes sections for seasonings and water as well as healthy fats.
MyPlate

MyPlate is the current nutrition guide published by the United States Department of Agriculture, depicting a place setting with a plate and glass divided into five food groups. It replaced the USDA's MyPyramid guide on June 2, 2011, concluding 19 years of USDA food pyramid diagrams.
See also
- Food and Nutrition Service
- Fruits & Veggies – More Matters
- Healthy diet
- Healthy eating pyramid
- History of USDA nutrition guides
- Human nutrition
- List of nutrition guides
- Nutrition Education
- Overall Nutritional Quality Index
References
- "American Heritage Dictionary Entry: food pyramid". Ahdictionary.com. Archived from the original on 2014-10-25. Retrieved 2015-02-05.
- "Ett provkok blev provkök" (in Swedish). kf.se. 2008-10-03. Archived from the original on 2015-03-09. Retrieved 2011-01-21.
- "KF Provkök lanserar idén om basmat (engl.: KF test-kitchen introduces the idea of foodgroups)" (in Swedish). coop.se. 1973. Archived from the original on 2011-09-29. Retrieved 2011-01-22.
- "matpyramid". Nationalencyklopedin (in Swedish). Archived from the original on 13 December 2010. Retrieved 7 June 2011.
- "Nutrition Plate Unveiled, Replacing Food Pyramid". The New York Times. 2 June 2011. Archived from the original on 3 June 2011. Retrieved 2 June 2011.
- "Food-Based Dietary Guidelines in Europe". EUFIC REVIEW 10/2009. www.eufic.org. 2009-10-01. Archived from the original on 2013-01-13. Retrieved 2011-01-26.
- Joint WHO/FAO Expert Consultation (2003). Diet, Nutrition and the Prevention of Chronic Diseases (PDF). WHO Technical Report Series. 916. Geneva. ISBN 978-9241209168. ISSN 0512-3054. Archived (PDF) from the original on 2013-10-31. page 56 table 6,
- Moynihan, P; Petersen, PE (2004). "Diet, nutrition and the prevention of dental diseases" (PDF). Public Health Nutrition. 7 (1A): 201–26. doi:10.1079/PHN2003589. PMID 14972061. Archived (PDF) from the original on 2016-05-18. Table 2
- Melnick, Meredith. "The USDA Ditches the Food Pyramid for a Plate". Time. ISSN 0040-781X. Archived from the original on 2016-07-18. Retrieved 2016-07-26.
- Russell, Robert M.; Rasmussen, Helen; Lichtenstein, Alice H. (1999). "Modified Food Guide Pyramid for people over seventy years of age". The Journal of Nutrition. 129 (3): 751–753. doi:10.1093/jn/129.3.751. PMID 10082784.
- Lichtenstein, A. H.; Rasmussen, H; Yu, W. W.; Epstein, S. R.; Russell, R. M. (2008). "Modified My Pyramid for Older Adults". The Journal of Nutrition. 138 (1): 5–11. doi:10.1093/jn/138.1.5. PMID 18156396.
- "7773-DGA_V7" (PDF). Archived (PDF) from the original on 2009-08-25. Retrieved 2009-09-28.
- Sahni S, Tucker KL, Kiel DP, Quach L, Casey VA, Hannan MT (24 April 2018). "Milk and yogurt consumption are linked with higher bone mineral density but not with hip fracture: the Framingham Offspring Study". Archives of Osteoporosis. 8 (1–2): 119. doi:10.1007/s11657-013-0119-2. PMC 3641848. PMID 23371478.
- Office of the Surgeon General (US) (2004). "Bone Health and Osteoporosis: A Report of the Surgeon General". PMID 20945569. Cite journal requires
|journal=(help) - Feskanich, D; Willett, W. C.; Colditz, G. A. (2003). "Calcium, vitamin D, milk consumption, and hip fractures: A prospective study among postmenopausal women". The American Journal of Clinical Nutrition. 77 (2): 504–511. doi:10.1093/ajcn/77.2.504. PMID 12540414.
- "Dietary Guidelines 2005: Two Steps Forward, One Step Back". Harvard School of Public Health. 2012-09-18. Archived from the original on 2015-04-02. Retrieved 2015-04-05.
- Nestle, M (1993). "Food lobbies, the food pyramid, and U.S. Nutrition policy". International Journal of Health Services. 23 (3): 483–496. doi:10.2190/32f2-2pfb-meg7-8hpu. PMID 8375951.
- Schlosberg, Suzanna; Neporent, Liz (2005-03-01). Fitness for Dummies. "For Dummies"and you.
- Burr, George O.; Burr, Mildred M. (1930-04-01). "On The Nature And Rôle Of The Fatty Acids Essential In Nutrition". The Journal of Biological Chemistry. 86 (2): 587–621. Archived from the original on 2009-06-01. Retrieved 2009-09-28.
- Stoll, A.L.; Locke, C.A.; Marangell, L.B.; Severus, W.E. (1999). "Omega-3 fatty acids and bipolar disorder: A review". Prostaglandins, Leukotrienes and Essential Fatty Acids. 60 (5–6): 329–337. doi:10.1016/S0952-3278(99)80008-8.
- Simopoulos, Artemis P (1999). "Essential fatty acids in health and chronic disease" (PDF). The American Journal of Clinical Nutrition. 70 (3 Suppl): 560–569. doi:10.1093/ajcn/70.3.560s. PMID 10479232. Archived (PDF) from the original on 2011-06-09.
- Hu, FB; Manson, JE; Willett, WC (2001). "Types of dietary fat and risk of coronary heart disease: A critical review". Journal of the American College of Nutrition. 20 (1): 5–19. doi:10.1080/07315724.2001.10719008. PMID 11293467.
- Christine L Pelkman; Valerie K Fishell; Deborah H Maddox; Thomas A Pearson; David T Mauger; Penny M Kris-Etherton (February 2004). "Effects of moderate-fat (from monounsaturated fat) and low-fat weight-loss diets on the serum lipid profile in overweight and obese men and women" (PDF). The American Journal of Clinical Nutrition. 79 (2): 204–212. doi:10.1093/ajcn/79.2.204. PMID 14749224. Archived (PDF) from the original on 2011-07-19. Retrieved 2011-04-18.
- Hu, Frank B.; Willett, WC (2002). "Optimal Diets for Prevention of Coronary Heart Disease". JAMA. 288 (20): 2569–78. doi:10.1001/jama.288.20.2569. PMID 12444864.
- Dobbins, RL; Chester, MW; Daniels, MB; McGarry, JD; Stein, DT (1998). "Circulating fatty acids are essential for efficient glucose-stimulated insulin secretion after prolonged fasting in humans". Diabetes. 47 (10): 1613–8. doi:10.2337/diabetes.47.10.1613. PMID 9753300.
- Ruderman, Neil B.; Toews, CJ; Shafrir, E (1969). "Role of Free Fatty Acids in Glucose Homeostasis". Archives of Internal Medicine. 123 (3): 299–313. doi:10.1001/archinte.1969.00300130081012. PMID 4303992.
- Toft, Ingrid (1995-12-15). "Effects of n-3 Polyunsaturated Fatty Acids on Glucose Homeostasis and Blood Pressure in Essential Hypertension: A Randomized, Controlled Trial". Annals of Internal Medicine. 123 (12): 911–8. doi:10.7326/0003-4819-123-12-199512150-00003. PMID 7486485.
- McCann, JC; Ames, BN (2005). "Is docosahexaenoic acid, an n-3 long-chain polyunsaturated fatty acid, required for development of normal brain function? An overview of evidence from cognitive and behavioral tests in humans and animals". The American Journal of Clinical Nutrition. 82 (2): 281–95. doi:10.1093/ajcn.82.2.281. PMID 16087970.
- Campbell, C.T. and Campbell, T.W., The China Study, (Dallas:BenBella Books, 2007, ISBN 978-1-932100-38-9 (cloth) ISBN 978-1-935251-00-2 (ebook))
- Nestle, M., Food Politics (Berkley:University of California Press, 2002, ISBN 0-520-22465-5)
- Reyes, Raphael (2008-07-15). "Food Pyramid Frenzy: Lobbyists Fight to Defend Sugar, Potatoes and Bread In Recommended U.S. Diet". Wall Street Journal. Retrieved 2006-12-09.
- Fuhrman, Joel, M.D. (2011) [2003]. Eat to Live. Little, Brown (Hachette). pp. 77–80. ISBN 978-0-316-12091-3.CS1 maint: multiple names: authors list (link)
- António José Marques da Silva (2015). La diète méditerranéenne. Discours et pratiques alimentaires en Méditerranée (vol. 2). Paris: L'Harmattan. pp. 49–51. ISBN 978-2-343-06151-1. Archived from the original on 2015-09-08.
- Haddad, Ella (1994). "Development of a vegetarian food guide" (PDF). The American Journal of Clinical Nutrition. 59 (52(suppl)): 1248S–1254S. doi:10.1093/ajcn/59.5.1248S. PMID 8172130. Retrieved 2011-06-20.
- Venti, Carol; Johnston, CS (2002). "Modified Food Guide Pyramid for Lactovegetarians and Vegans" (PDF). The Journal of Nutrition. 132 (5): 1050–1054. doi:10.1093/jn/132.5.1050. PMID 11983836. Archived from the original on 2014-08-16. Retrieved 2011-06-20.
- Messina, Virginia; Melina, V; Mangels, AR (2007). "A New Food Guide: For North American Vegetarians". Canadian Journal of Dietetic Practice and Research. 64 (2): 82–86. CiteSeerX 10.1.1.602.3760. doi:10.3148/64.2.2003.82. PMID 12826029. Archived from the original on 2016-05-08.
- http://veganfoodpyramid.com Archived 2015-05-03 at the Wayback Machine Also in other languages: "Archived copy". Archived from the original on 2010-07-27. Retrieved 2015-05-07.CS1 maint: archived copy as title (link)
External links
| Dieting |
| ||||||||||||||||||||||
|---|---|---|---|---|---|---|---|---|---|---|---|---|---|---|---|---|---|---|---|---|---|---|---|
| Nutrition |
| ||||||||||||||||||||||
| Nutritional advice |
| ||||||||||||||||||||||