

Teen Drinking and Driving infographic
 ShareCompartir
The percentage of teens in high school, aged 16 years or older, who drink and drive has decreased by more than half.
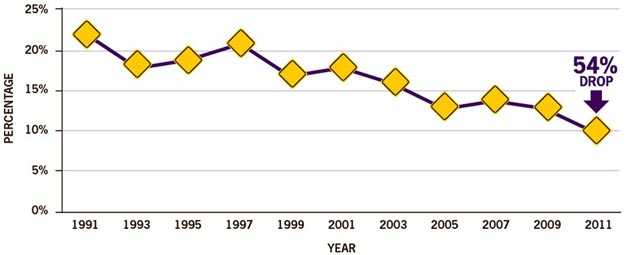
Source: Youth Risk Behavior Surveys, United States, 1991-2011
Percentage of high school students aged≥16 years who drove when they had been drinking alcohol*
This chart shows the percentage of high school students ages 16 years or older who drove when they had been drinking alcohol from 1991 to 2011. In 1991, 22% of males and female students said that they drink and drive, versus 10% in 2011. In 1991, 28% of male high school students ages 16 and older said that they drink and drive, compared to 12% in 2011. And in 1991, 16% of female high school students age 16 and older said that they drive and drink, compared to 9% in 2011.
Some teens in high school drink and drive more than others.
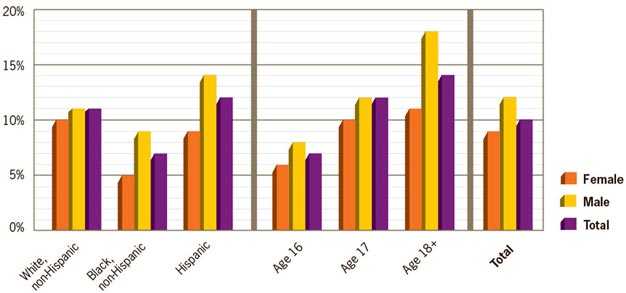
SOURCE: Youth Risk Behavior Survey, United States, 2011
This graphic shows that some teens drink and drive more than others, based on 2011 data. Among White non-Hispanic teens, Black non-Hispanic teens, and Hispanic teens, Hispanic males were most likely to drink and drive. Black non-Hispanic females were least likely to drink and drive. Among all ethnicities together, males age 18 and older were most likely to drink and drive, while 16 year old females were least likely to drink and drive.
Percentage of teens in high school, aged 16 years or older, who reported drinking and driving, by state.
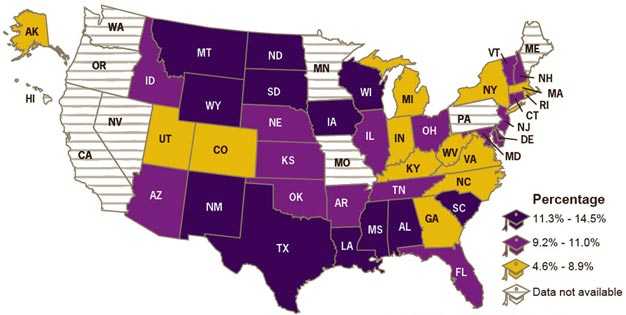
SOURCE: Youth Risk Behavior Surveys, 41 states, 2011
Data not available for CA, HI, ME, MN, MO, NV, OR, PA, and WA.
This map of the United States shows the percentage of teens in high school, ages 16 years or older, who reported drinking and driving, by state. Data were not available for California, Hawaii, Minnesota, Maine, Missouri, Nevada, Oregon, Pennsylvania, and Washington. For all other states, the percentages of high school students who said they drink and drive were as follows:
| Percentage of teens in high school, ages 16 years or older, who reported drinking and driving, by state | ||
|---|---|---|
| State | Percent | |
| Alabama | 11.7 | |
| Alaska | 6.7 | |
| Arizona | 10.7 | |
| Arkansas | 11.0 | |
| Colorado | 8.5 | |
| Connecticut | 9.4 | |
| Delaware | 9.7 | |
| Florida | 11.0 | |
| Georgia | 8.4 | |
| Idaho | 10.1 | |
| Illinois | 10.4 | |
| Indiana | 6.5 | |
| Iowa | 13.6 | |
| Kansas | 10.9 | |
| Kentucky | 7.9 | |
| Louisiana | 13.9 | |
| Maryland | 10.4 | |
| Massachusetts | 8.9 | |
| Michigan | 7.5 | |
| Mississippi | 12.6 | |
| Montana | 13.4 | |
| Nebraska | 11.0 | |
| New Hampshire | 10.5 | |
| New Jersey | 9.2 | |
| New Mexico | 11.3 | |
| New York | 6.7 | |
| North Carolina | 7.7 | |
| North Dakota | 14.5 | |
| Ohio | 9.3 | |
| Oklahoma | 9.2 | |
| Rhode Island | 8.3 | |
| South Carolina | 11.7 | |
| South Dakota | 12.7 | |
| Tennessee | 9.7 | |
| Texas | 12.6 | |
| Utah | 4.6 | |
| Vermont | 9.2 | |
| Virginia | 6.8 | |
| West Virginia | 8.6 | |
| Wisconsin | 12.0 | |
| Wyoming | ||
- Page last reviewed: November 14, 2012
- Page last updated: November 14, 2012
- Content source:
- National Center for Injury Prevention and Control
- Page maintained by: Office of the Associate Director for Communications (OADC)