

Making Health Care Safer Infographics
More people at risk, multiple drugs abused
 ShareCompartir
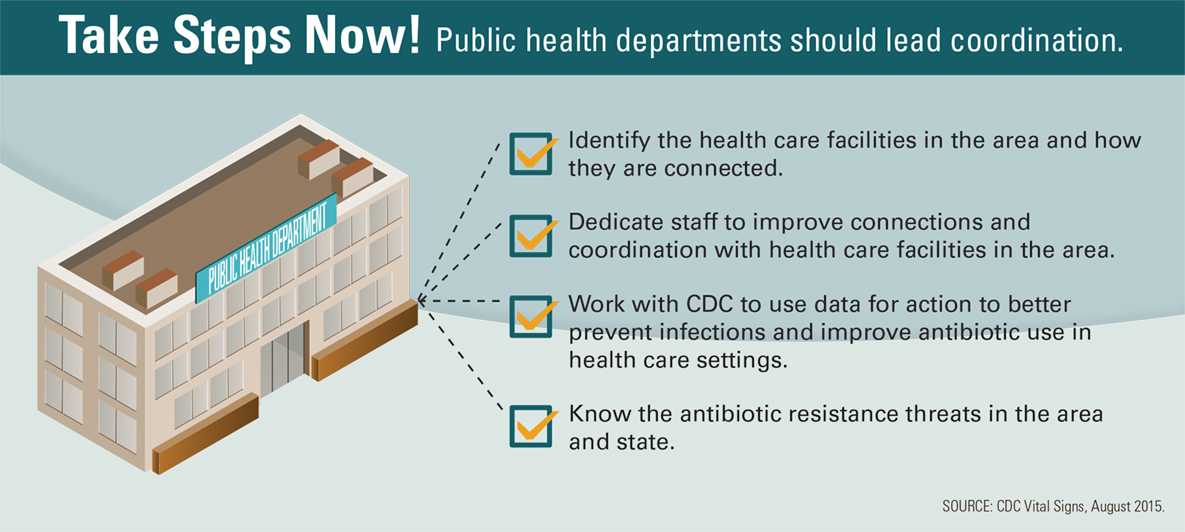
Graphic with an illustration of the public health department on the left and four text lines on the right. Title is “Take Steps Now! Public health departments should lead coordination.” Bulleted text states:
- Identify the health care facilities in the area and how they are connected
- Dedicate staff to improve connections and coordination with health care facilities in the area.
- Work with CDC to use data for action to better prevent infections and improve antibiotic use in health care settings.
- Know the antibiotic resistance threats in the area and state.
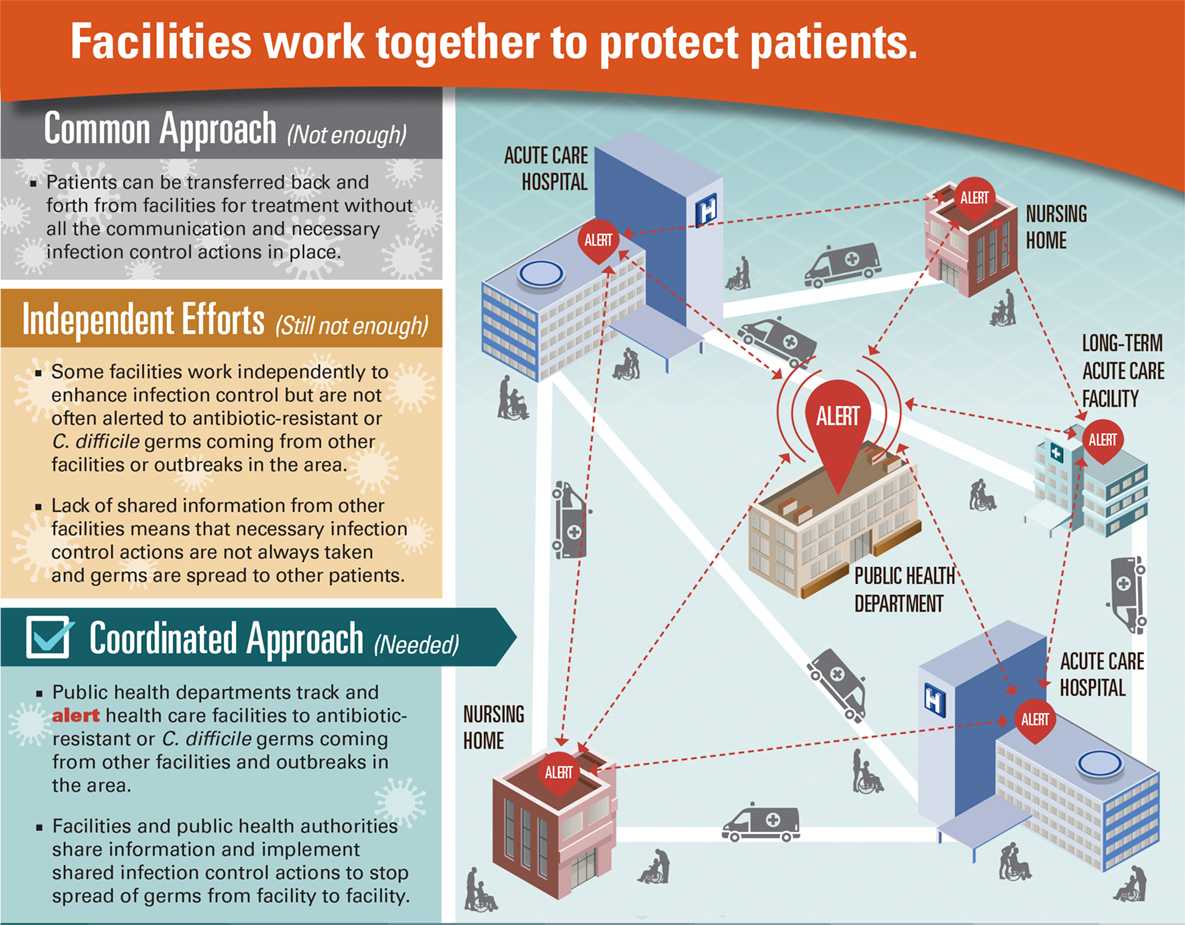
Graphic with text on the left and an illustration on the right. Title is “Facilities work together to protect patients.”
Text on the left is broken into 3 categories:
- Common Approach (Not enough)
- Patients can be transferred back and forth from facilities for treatment without all the communication and necessary infection control actions in place.
- Independent Efforts (Still not enough)
- Some facilities work independently to enhance infection control but are not often alerted to antibiotic-resistant or C. difficile germs coming from other facilities or outbreaks in the area.
- Lack of shared information from other facilities means that necessary infection control actions are not always taken and germs are spread to other patients.
- Coordinated Approach (Needed)
- Public health departments track and alert health care facilities to antibiotic-resistant or C. difficile germs coming from other facilities and outbreaks in the area.
- Facilities and public health authorities share information and implement shared infection control actions to stop spread of germs from facility to facility.
Illustration on right depicts two acute care hospitals, two nursing homes, and one long-term acute care hospital in an area. Ambulances traveling on roads between the facilities signify patient transfers. The state health department, situated in the middle of the facilities, alerts the area. Arrows represent communication and information moving from health department to facilities, and from facility to facility.
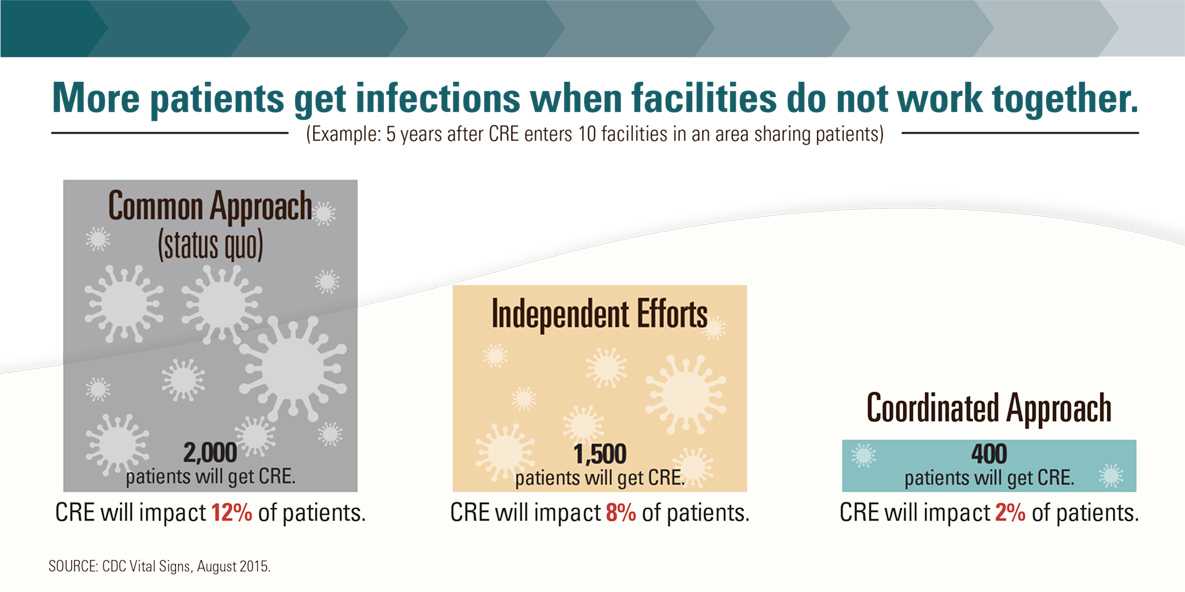
Graphic titled “More patients get infections when health care facilities do not work together.”
A bar graph depicts the following example. Five years after CRE enters 10 health care facilities in an area sharing patients:
- With the Common Approach (status quo), CRE will impact 12% of patients. 2,000 patients will get CRE.
- With Independent Efforts, CRE will impact 8% of patients. 1,500 patients will get CRE.
- With Coordinated Approach, CRE will impact 2% of patients. 400 patients will get CRE.
- Page last reviewed: August 4, 2015
- Page last updated: August 4, 2015
- Content source:
Error processing SSI file