Adult Smoking: Focusing on People with Mental Illness

Percent of Adults with Mental Illness Who Smoke
By Sex: 40% Men, 35% Women.
By Poverty Level: 33% At or above poverty, 48% below poverty.

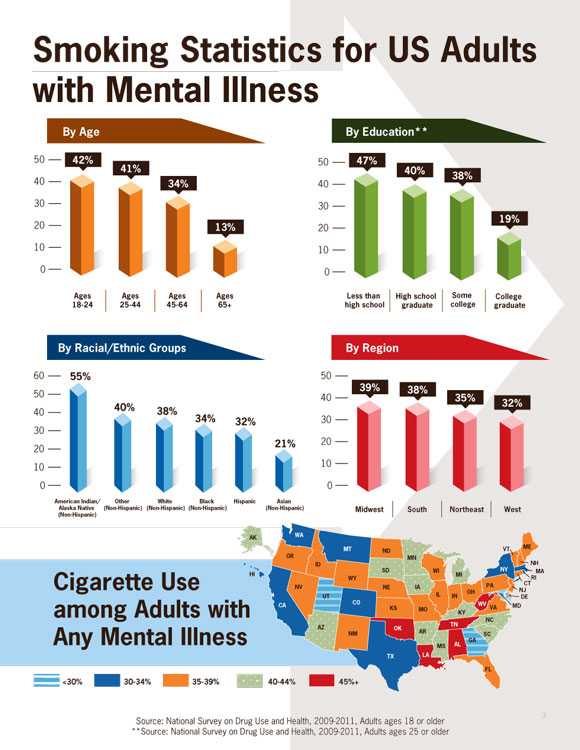
Smoking Statistics for US Adults with mental Illness
-
By Age
- Ages 18-24 – 42%
- Ages 25-44 – 41%
- Ages 45-64 – 34%
- Ages 65+ – 13%
-
By Education
- Less than high school – 47%
- High school graduate – 40%
- Some college – 38%
- College graduate – 19%
-
By Racial/Ethnic Groups
- American Indian/Alaska Native (Non-Hispanic) – 55%
- Other (Non-Hispanic – 40%
- White (Non-Hispanic) – 38%
- Black (Non-Hispanic) – 34%
- Hispanic – 32%
- Asian (Non-Hispanic) – 21%
-
By Region
- Midwest – 39%
- South – 38%
- Northeast – 35%
- West – 32%
Color-coded U.S. map: Cigarette Use Among Adults with Any Mental Illness
- States that have less than 30%: Georgia and Utah
- States that have 30 to 34%: California, Colorado, Hawaii, Maryland, Massachusetts, Montana, New York, Rhode Island, Texas and Washington
- States that have 35 to 39%: Conneticut, Delaware, Florida, Kansas, Idaho, Illinois, Indiana, Maine, Missouri, Oregon, Nebraska, New Hampshire, New Jersey, New Mexico, Nevada, North Dakota, Ohio,Pennsylvania, Vermont, Virginia, Wisconsin, and Wyoming.
- States that have 40 to 44%: Arkansas, Arizona, Iowa, Kentucky, Michigan, Minnesota, Mississippi, North Carolina, South Carolina, and South Dakota
- States that have 45% or more: Alabama, Louisiana, Oklahoma, Tennessee, and West Virginia
- Page last reviewed: February 5, 2013
- Page last updated: February 5, 2013
- Content source:
- National Center for Chronic Disease Prevention and Health Promotion, Office on Smoking and Health
- Page maintained by: Office of the Associate Director for Communications (OADC)


 ShareCompartir