

Opioid Painkiller Prescribing infographic
 ShareCompartir
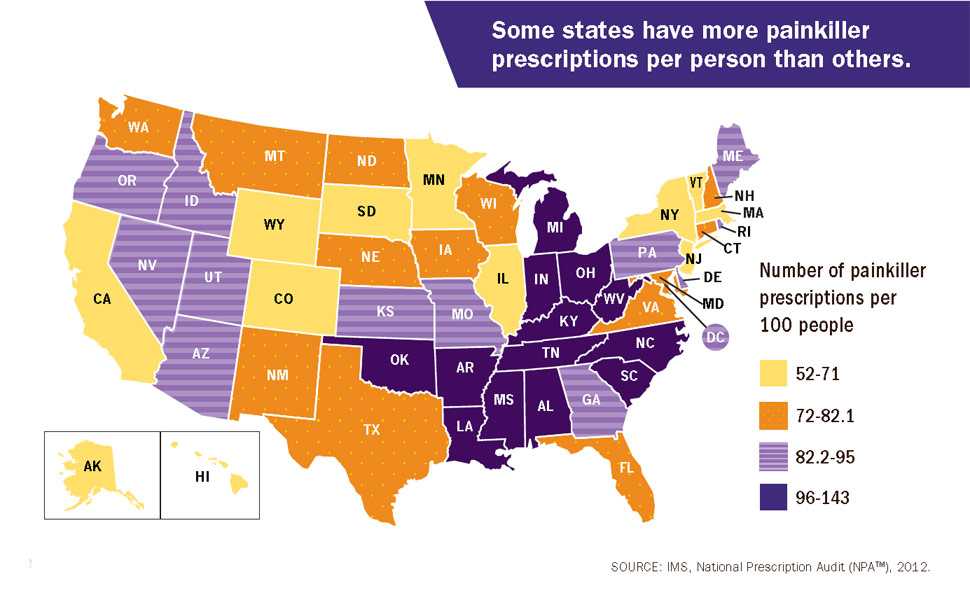
Some states have more painkiller prescriptions per person than others.
This color-coded U.S. map shows the number of painkiller prescriptions per 100 people in each of the fifty states plus the District of Columbia in 2012. Data from IMS, National Prescription Audit (NPATM), 2012.
| Quartile (Painkiller Prescriptions per 100 People) |
States |
|---|---|
| 52-71 | HI, CA, NY, MN, NJ, AK, SD, VT, IL, WY, MA, CO |
| 72-82.1 | NH, CT, FL, IA, NM, TX, MD, ND, WI, WA, VA, NE, MT |
| 82.2-95 | AZ, ME, ID, DC, UT, PA, OR, RI, GA, DE, KS, NV, MO |
| 96-143 | NC, OH, SC, MI, IN, AR, LA, MS, OK, KY, WV, TN, AL |
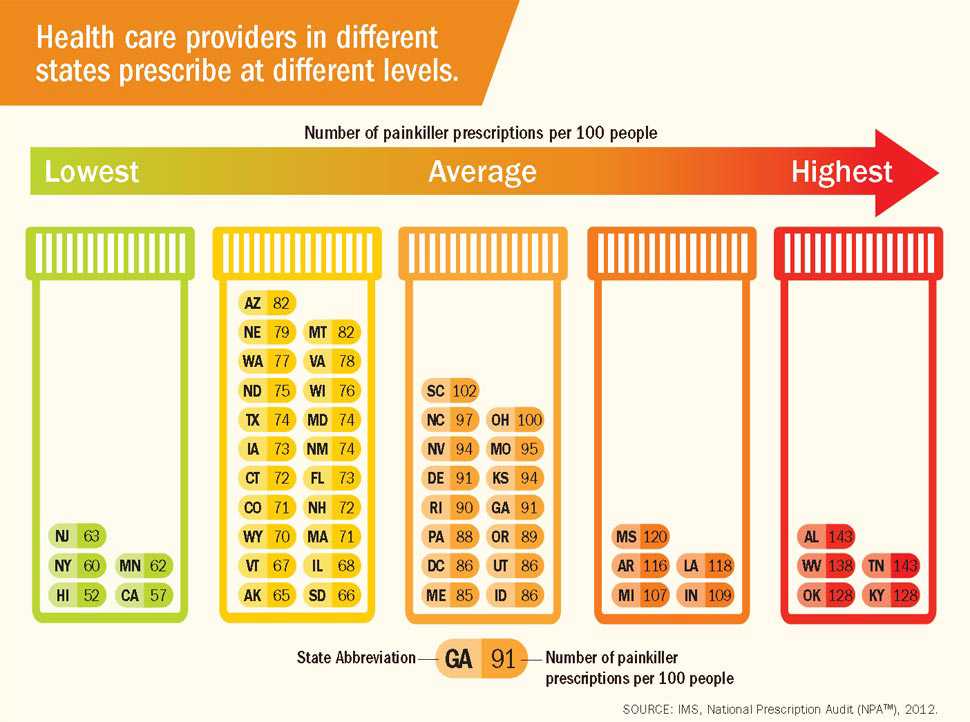
Health care providers in different states prescribe at different levels.
This graphic orders the fifty states plus the District of Columbia by the number of painkiller prescriptions per 100 people. There are five pill bottles:
- The green bottle contains states that have the lowest number of prescription painkillers per 100 people: 52-63 (5 states).
- The yellow bottle contains states that have 65-82 prescription painkillers per 100 people (21 states).
- The orange bottle contains states that have 85-102 prescription painkillers per 100 people (15 states).
- The red-orange bottle contains states that have 107 to 120 prescription painkillers per 100 people (5 states).
- The red bottle contains states that have the highest number of prescription painkillers per 100 people: 128-143 (5 states).
| State | Painkiller Prescriptions per 100 People |
|---|---|
| HI | 52 |
| CA | 57 |
| NY | 60 |
| MN | 62 |
| NJ | 63 |
| State | Painkiller Prescriptions per 100 People |
|---|---|
| AK | 65 |
| SD | 66 |
| VT | 67 |
| IL | 68 |
| WY | 70 |
| MA | 71 |
| CO | 71 |
| NH | 72 |
| CT | 72 |
| FL | 73 |
| IA | 73 |
| NM | 74 |
| TX | 74 |
| MD | 74 |
| ND | 75 |
| WI | 76 |
| WA | 77 |
| VA | 78 |
| NE | 79 |
| MT | 82 |
| AZ | 82 |
| State | Painkiller Prescriptions per 100 People |
|---|---|
| ID | 86 |
| DC | 86 |
| UT | 86 |
| PA | 88 |
| OR | 89 |
| RI | 90 |
| GA | 91 |
| DE | 91 |
| KS | 94 |
| NV | 94 |
| MO | 95 |
| NC | 97 |
| OH | 100 |
| SC | 102 |
| State | Painkiller Prescriptions per 100 People |
|---|---|
| MI | 107 |
| IN | 109 |
| AR | 116 |
| LA | 118 |
| MS | 120 |
| State | Painkiller Prescriptions per 100 People |
|---|---|
| OK | 128 |
| KY | 128 |
| WV | 138 |
| TN | 143 |
| AL | 143 |
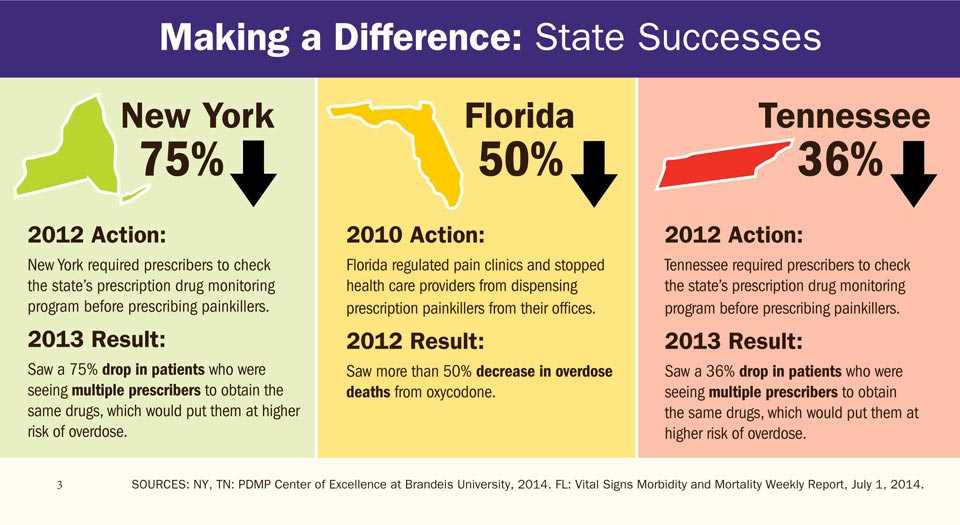
New York down 75%
2012 Action:
New York required prescribers to check the state’s prescription drug monitoring program before prescribing painkillers.
2013 Result: Saw a 75% drop in patients who were seeing multiple prescribers to obtain the same drugs, which would put them at higher risk of overdose.
Florida down 50%
2010 Action:
Florida regulated pain clinics and stopped health care providers from dispensing prescription painkillers from their offices.
2012 Result: Saw more than 50% decrease in overdose deaths from oxycodone.
Tennessee down 36%
2012 Action:
Tennessee required prescribers to check the state’s prescription drug monitoring program before prescribing painkillers.
2013 Result: Saw a 36% drop in patients who were seeing multiple prescribers to obtain the same drugs, which would put them at higher risk of overdose.
SOURCES: NY, TN: PDMP Center of Excellence at Brandeis University, 2014. FL: Vital Signs Morbidity and Mortality Weekly Report, July 1, 2014.
- Page last reviewed: July 1, 2014
- Page last updated: July 1, 2014
- Content source:
- National Center for Injury Prevention and Control, Division of Unintentional Injury Prevention
- Page maintained by: Office of the Associate Director for Communications (OADC)