

Motor Vehicle Crash Deaths
How is the US doing?
 ShareCompartir
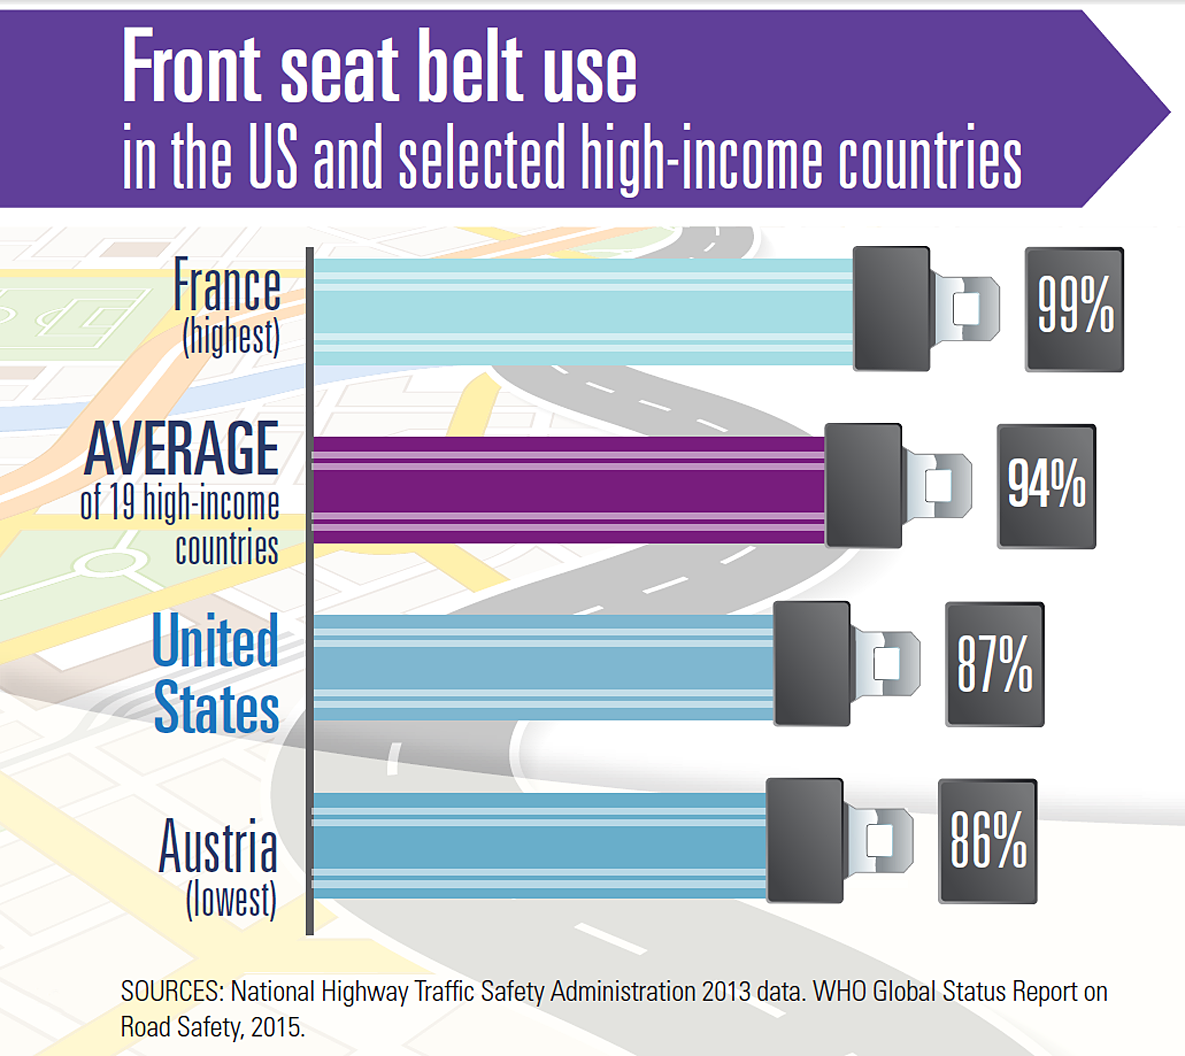
Front seat belt use in the US and selected high-income countries
| Country | Percentage % |
|---|---|
| France (highest) | 99% |
| Average of 19 high-income countries | 94% |
| UnitedStates | 87% |
| Austria (lowest) | 86% |
SOURCES: National Highway Traffic Safety Administration 2013 data. WHO Global Status Report on Road Safety, 2015.
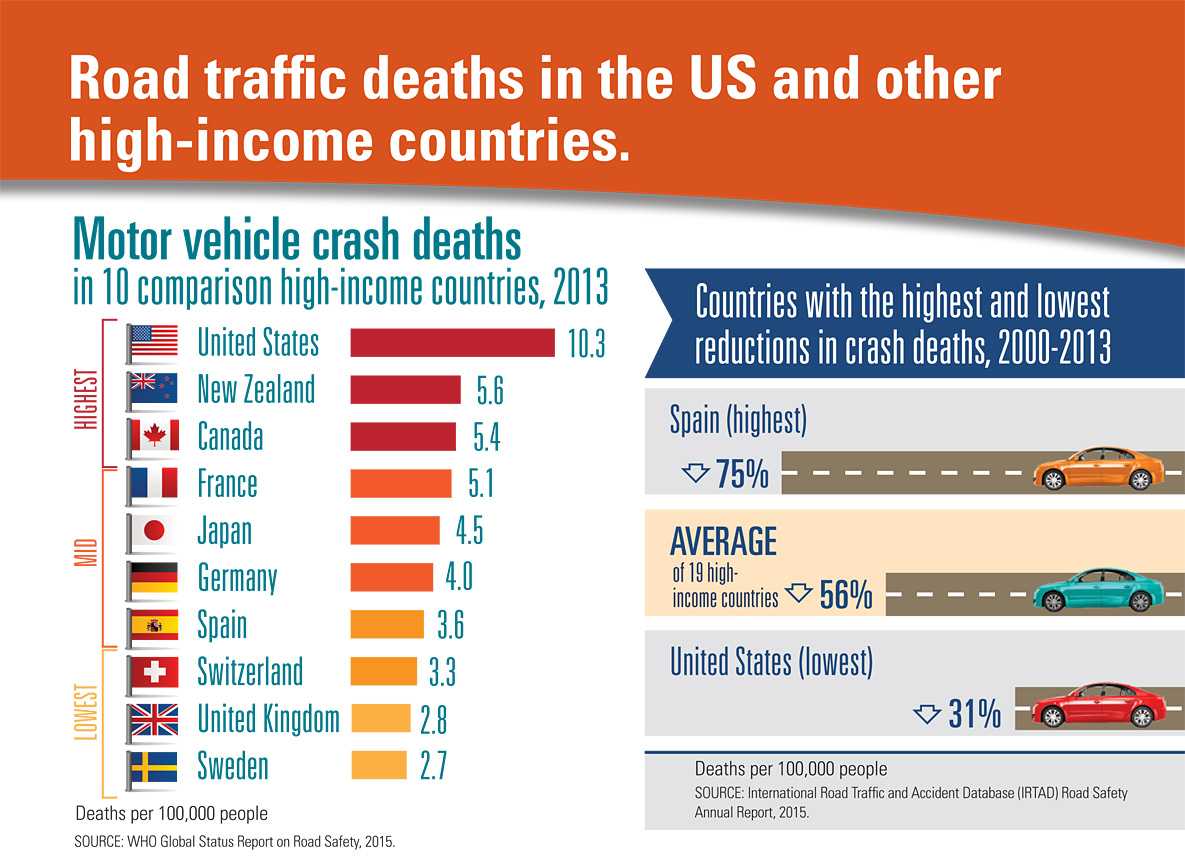
Motor vehicle crash deaths in 10 comparison high-income countries, 2013
| Category | Country | Deaths |
|---|---|---|
| Highest | USA | 10.3 |
| New Zealand | 5.6 | |
| Canada | 5.4 | |
| Mid | France | 5.1 |
| Japan | 4.5 | |
| Germany | 4.0 | |
| Spain | 3.6 | |
| Lowest | Switzerland | 3.3 |
| United Kingdom | 2.8 | |
| Sweden | 2.7 |
Deaths per 100,000 people
SOURCE: WHO Global Status Report on Road Safety, 2015
Countries with the highest and lowest reductions in crash deaths, 2000-2013
| Country | Percentage % |
|---|---|
| Spain (highest) | 75% |
| Average of 19 high-income countries | 56% |
| United States (lowest) | 31% |
Deaths per 100,000 people
SOURCE: International Road Traffic and Accident Database (IRTAD) Road Safety Annual Report, 2015
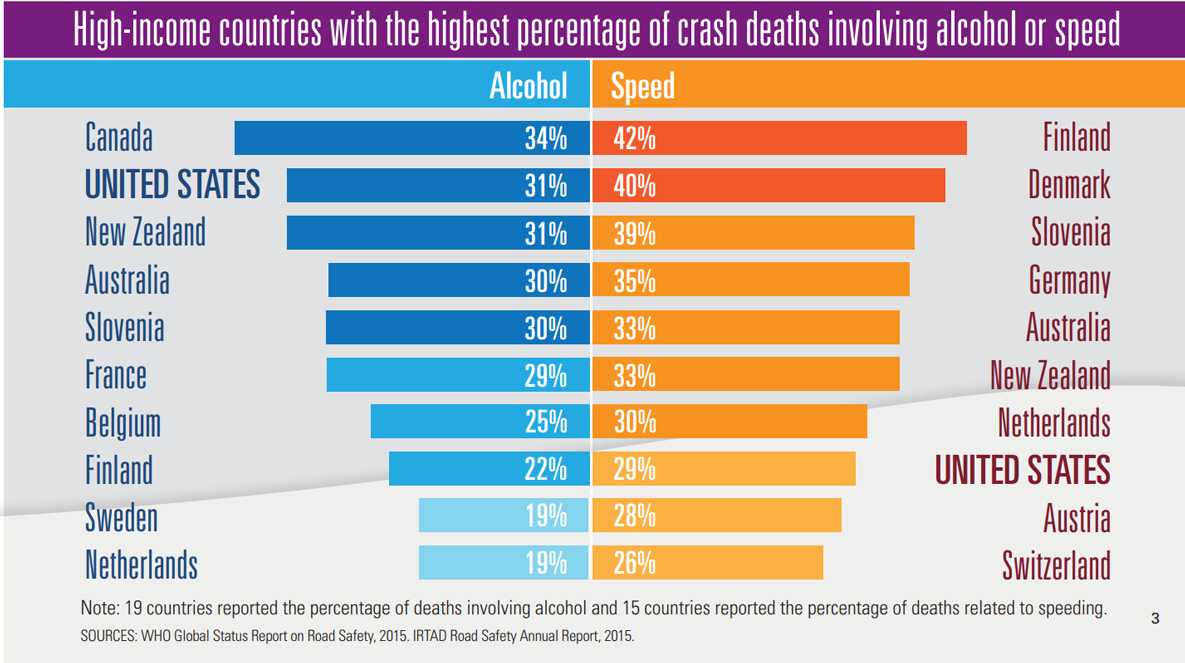
High-income countries with the highest percentage of crash deaths involving alcohol or speed
| Alcohol | Speed | ||
|---|---|---|---|
| Canada | 34% | Finland | 42% |
| United States | 31% | Denmark | 40% |
| New Zealand | 31% | Slovenia | 39% |
| Australia | 30% | Germany | 35% |
| Slovenia | 30% | Australia | 33% |
| France | 29% | New Zealand | 33% |
| Belgium | 25% | Netherlands | 30% |
| Finland | 22% | United States | 29% |
| Sweden | 19% | Austria | 28% |
| Netherlands | 19% | Switzerland | 26% |
Note: 19 countries reported the percentage of deaths involving alcohol and 15 countries reported the percentage of deaths related to speeding.
SOURCES: WHO Global Status Report on Road Safety, 2015. IRTAD Road Safety Annual Report, 2015.
- Page last reviewed: July 6, 2016
- Page last updated: July 18, 2016
- Content source:
Error processing SSI file