

Heart Age Infographics
Is Your Heart Older Than You?
 ShareCompartir
Women
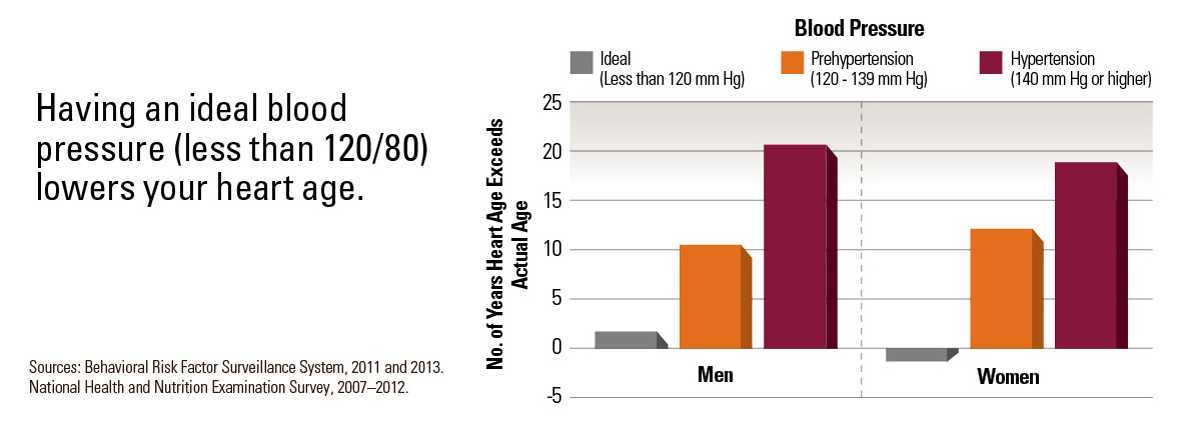
Having an ideal blood pressure (less than 120/80) lowers your heart age.
- Men: SBP<120; Mean Excess Heart Age: 1.8; Margin of error: 0.27
- Men: 120<=SBP<140; Mean Excess Heart Age: 10.5; Margin of error: 0.10
- Men: SBP>=140; Mean Excess Heart Age: 20.6; Margin of error: 1.14
- Women: SBP<120; Mean Excess Heart Age: -1.2; Margin of error: 0.19
- Women: 120<=SBP<140; Mean Excess Heart Age: 12.2; Margin of error: 0.18
- Women: SBP>=140; Mean Excess Heart Age: 18.8; Margin of error: 0.85
Sources: Behavioral Risk Factor Surveillance System, 2011 and 2013.
National Health and Nutrition Examination Survey, 2007–2012.
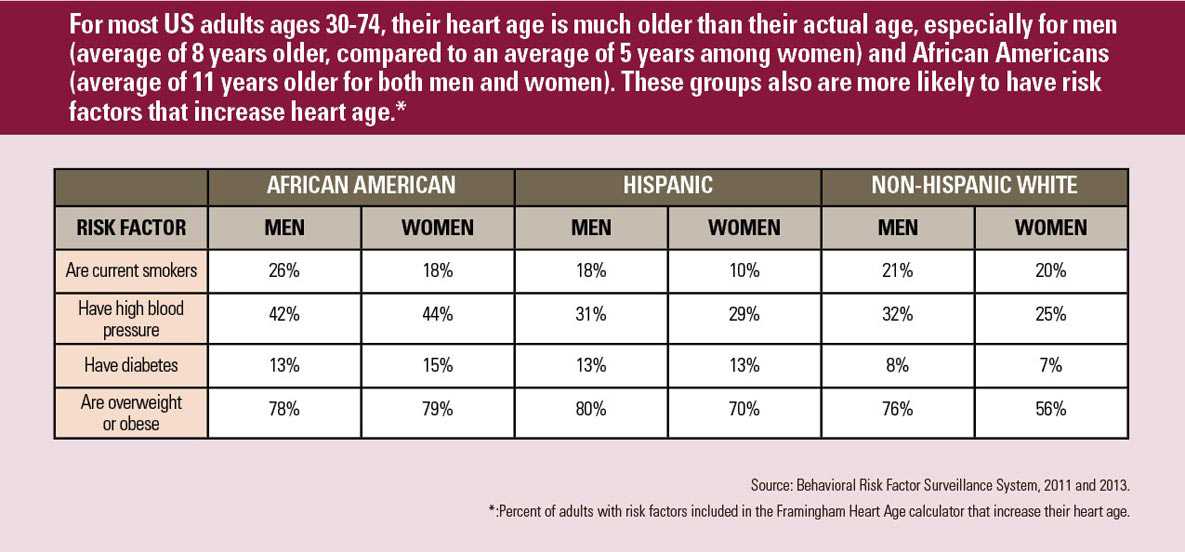
For most US adults ages 30-74, their heart age is much older than their actual age, especially for men
(average of 8 years older, compared to an average of 5 years among women) and African Americans
(average of 11 years older for both men and women). These groups also are more likely to have risk
factors that increase heart age.*
| AFRICAN AMERICAN | HISPANIC | NON-HISPANIC WHITE | ||||
|---|---|---|---|---|---|---|
| RISK FACTOR | MEN | WOMEN | MEN | WOMEN | MEN | WOMEN |
| Are current smokers | 26% | 18% | 18% | 10% | 21% | 20% |
| Have high blood pressure | 42% | 44% | 31% | 29% | 32% | 25% |
| Have diabetes | 13% | 15% | 13% | 13% | 8% | 7% |
| Are overweight or obese | 78% | 79% | 80% | 70% | 76% | 56% |
Source: Behavioral Risk Factor Surveillance System, 2011 and 2013.
* Percent of adults with risk factors included in the Framingham Heart Age calculator that increase their heart age.
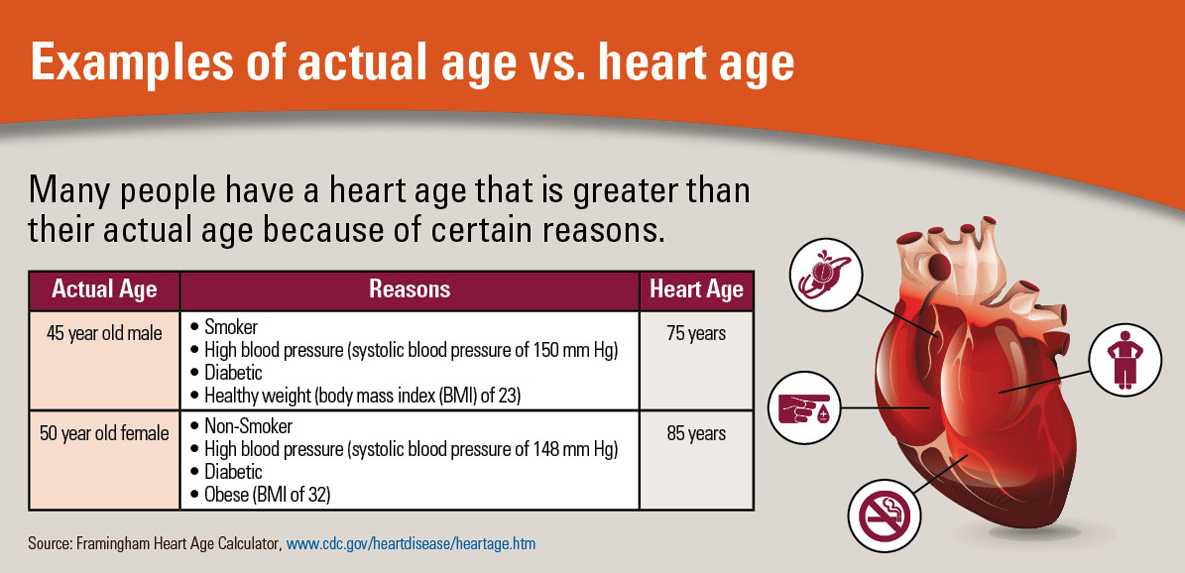
Examples of actual age vs. heart age
Many people have a heart age that is greater than their actual age because of certain reasons.
| Actual Age | Reasons | Heart Age |
|---|---|---|
| 45 year old male |
|
75 years |
| 50 year old female |
|
85 years |
Source: Framingham Heart Age Calculator, www.cdc.gov/heartdisease/heartage.htm
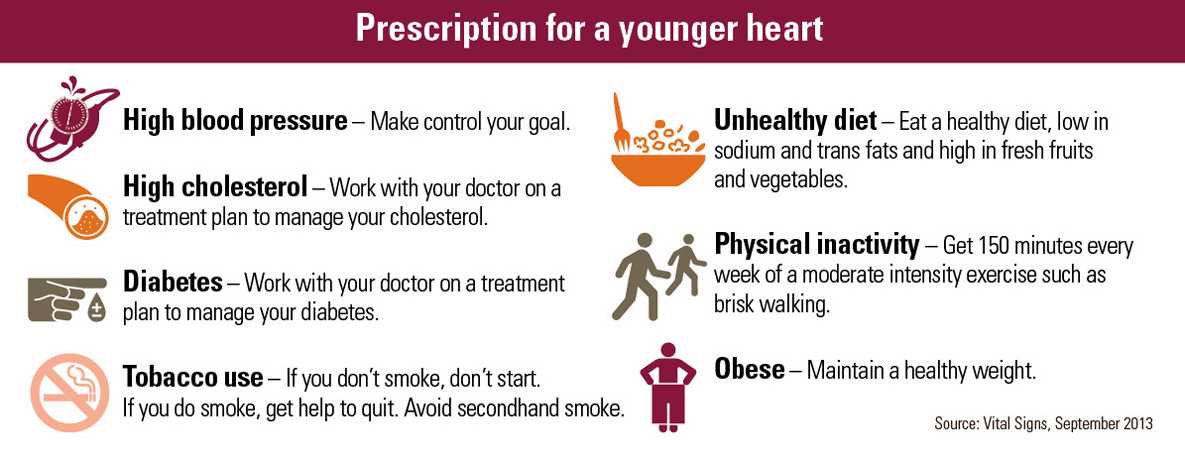
Prescription for a younger heart
- High blood pressure – Make control your goal.
- High cholesterol – Work with your doctor on a treatment plan to manage your cholesterol.
- Diabetes – Work with your doctor on a treatment plan to manage your diabetes.
-
Tobacco use – If you don’t smoke, don’t start.
If you do smoke, get help to quit. Avoid secondhand smoke. - Unhealthy diet – Eat a healthy diet, low in sodium and trans fats and high in fresh fruits and vegetables.
- Physical inactivity – Get 150 minutes every week of a moderate intensity exercise such as brisk walking.
- Obese – Maintain a healthy weight.
Source: Vital Signs, September 2013
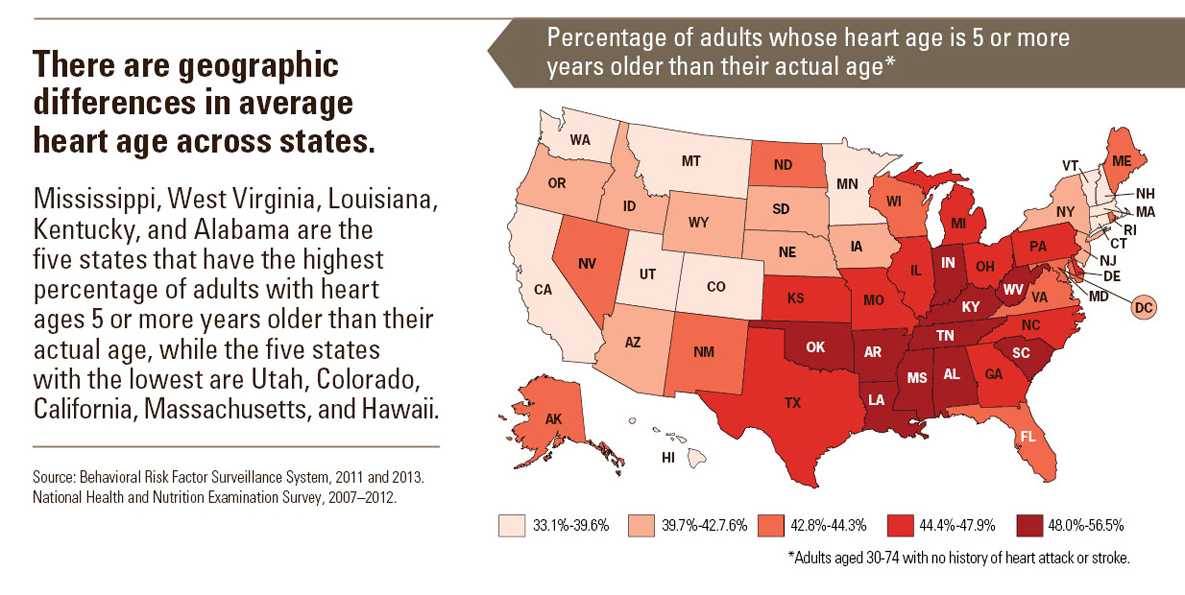
There are geographic differences in average heart age across states.
Mississippi, West Virginia, Louisiana, Kentucky, and Alabama are the five states that have the highest percentage of adults with heart ages 5 or more years older than their actual age, while the five states with the lowest are Utah, Colorado, California, Massachusetts, and Hawaii.
Source: Behavioral Risk Factor Surveillance System, 2011 and 2013.
National Health and Nutrition Examination Survey, 2007–2012.
Percentage of adults whose heart age is 5 or more years older than their actual age*
- 33.1%-39.6%: California, Washington, Utah, Montana, Colorado, Minnesota, Vermont, Massachusetts, Connecticut, Hawaii.
- 39.7%-42.76%: Oregon, Idaho, Arizona, Wyoming, South Dakota, Nebraska, Iowa, New York, New Jersey.
- 42.8%-44.3%: Nevada, Alaska, New Mexico, North Dakota, Wisconsin, Florida, Virginia, Maryland, Delaware, Washington, DC.
- 44.4%-47.9%: Texas, Kansas, Missouri, Illinois, Michigan, Ohio, Georgia, North Carolina, Pennsylvania.
- 48.0%-56.5%: Oklahoma, Arkansas, Louisiana, Mississippi, Alabama, Tennessee, Kentucky, Indiana, West Virginia, South Carolina.
*Adults aged 30-74 with no history of heart attack or stroke.
- Page last reviewed: September 1, 2015
- Page last updated: September 1, 2015
- Content source:
- National Center for Chronic Disease Prevention and Health Promotion
- Page maintained by: Office of the Associate Director for Communications (OADC)