

Access to Health Care infographic
 ShareCompartir
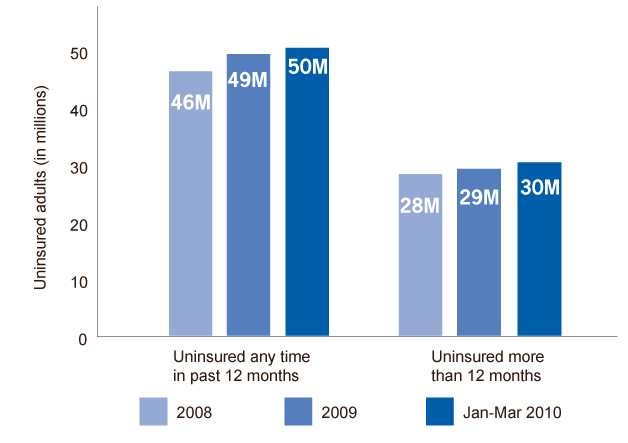
This graph shows how many adults between 18 and 64 years old were uninsured every year since 2008. There are two groups and the number of uninsured people increased every year in both groups. Specifically, 28 million adults were uninsured for more than a year in 2008, 29 million in 2009, and 30 million in the first 3 months of 2010. At the same time, 46, 49, and 50 million people reported that they had been uninsured for part of the previous year in 2008, 2009, and the first 3 months of 2010. The data come from the National Health Interview Survey and are available at http://www.cdc.gov/nchs/nhis.htm.

This graph shows how disability affects access to health care. About 60% of adults 18 â€" 64 years who had no insurance coverage for all or part of the last 12 months or more, skipped or delayed medical care because of cost. Among those adults with continuous insurance coverage during the past year, 16% of people (or 1 in 6) with a disability and 5-point-8 percent of people without a disability skipped or delayed medical care. The data come from the National Health Interview Survey.
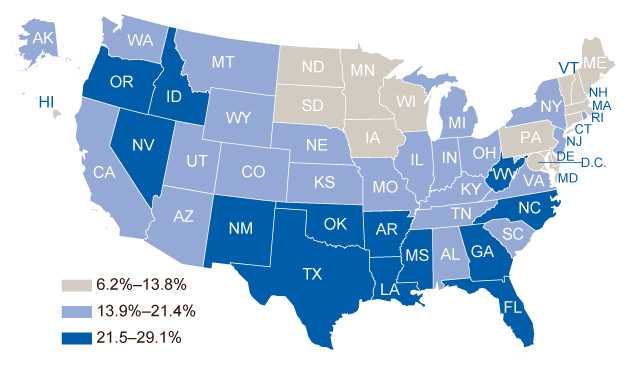
This graph shows which states have the most people without health insurance. States are ranked by the number of residents reporting that they had no health insurance in 2009. The states range from 6% in Massachusetts to 29% in Texas. Nine of the highest 13 states where the most people lack health insurance are located in the South. The data come from the 2009 Behavioral Risk Factor Surveillance System.
- Page last reviewed: November 10, 2010
- Page last updated: November 10, 2010
- Content source:
Error processing SSI file