Motor Vehicle Crash Injuries infographic

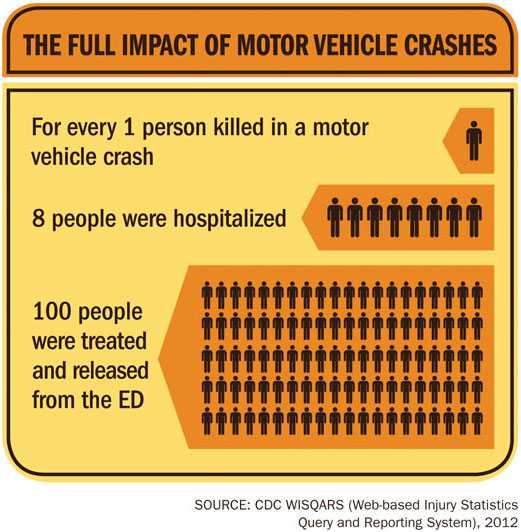
Title: The Full Impact of Motor Vehicle Crashes
This infographic shows that for every 1 person who is killed in a motor vehicle crash, 8 people were hospitalized, and 100 people were treated and released from the ED.
Source: CDC WISQARS (Web-based Injury Statistics Query and Reporting System), 2012

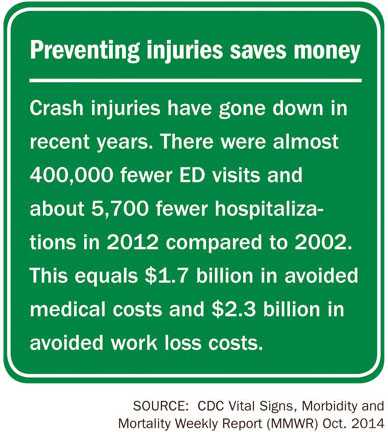
Title: Preventing Injuries Saves Money
This call out box says: Crash injuries have gone down in recent years. There were almost 400,000 fewer ED visits and about 5,700 fewer hospitalizations in 2012 compared to 2002. This equals $1.7 billion in avoided medical costs and $2.3 billion in avoided work loss costs.
Source: CDC Vital Signs, Morbidity and Mortality Weekly Report (MMWR) Oct. 2014
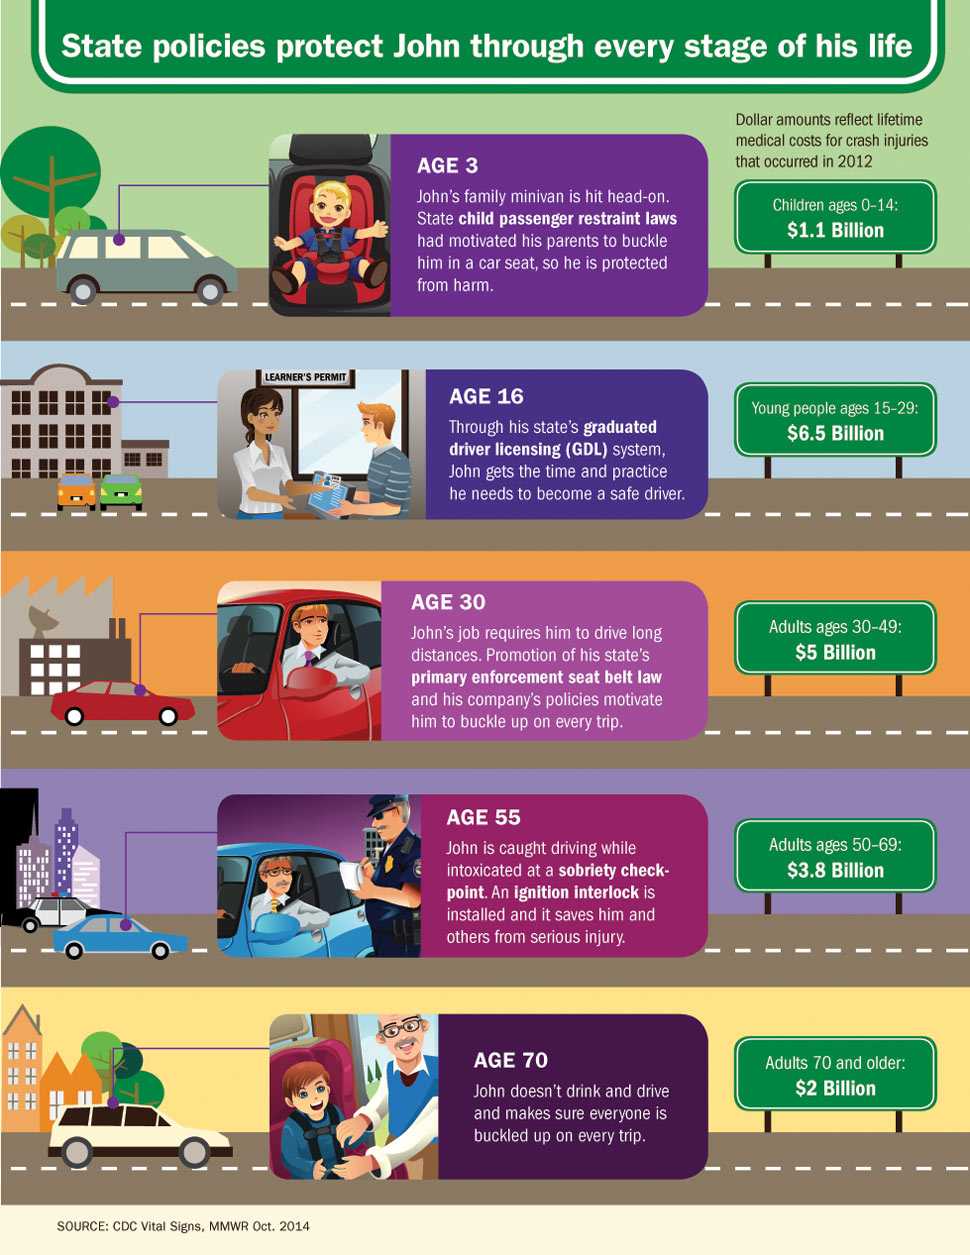
This infographic shows John at ages 3, 16, 30, 55, and 70. At each age, he is protected by a different state policy.
- AGE 3 (picture shows John in a car seat): John’s family mini-van is hit head-on. State child passenger restraint laws had motivated his parents to buckle him in a car seat, so he is protected from harm.
- AGE 16 (picture shows John getting his learner’s permit): Through his state’s graduated driver licensing (GDL) system, John gets the time and practice he needs to become a safe driver.
- AGE 30 (picture shows John buckled up in his car): John job requires him to drive for long distances. Promotion of his state’s primary enforcement seat belt law and his company’s policies motivate him to buckle up on every trip.
- AGE 55 (picture shows John at a traffic stop with a police officer): John is caught driving while intoxicated at a sobriety checkpoint. An ignition interlock is installed and it saves him and others from serious injury.
- AGE 70 (picture shows John buckling up his grandson in a car seat): John doesn’t drink and drive, and makes sure everyone is buckled up on every trip.
On the right side of the infographic is an icon at each stage of life that shows this information:
| Age | Lifetime medical costs for crash injuries that occurred in 2012 |
|---|---|
| Children ages 0-14 | $1.1 Billion |
| Young people ages 15-29 | $6.5 Billion |
| Adults ages 30-49 | $5 Billion |
| Adults ages 50-69 | $3.8 Billion |
| Adults ages 70 and older | $2 Billion |
- Page last reviewed: October 7, 2014
- Page last updated: October 7, 2014
- Content source:
- National Center for Injury Prevention and Control, Division of Unintentional Injury Prevention
- Page maintained by: Office of the Associate Director for Communications (OADC)


 ShareCompartir
