

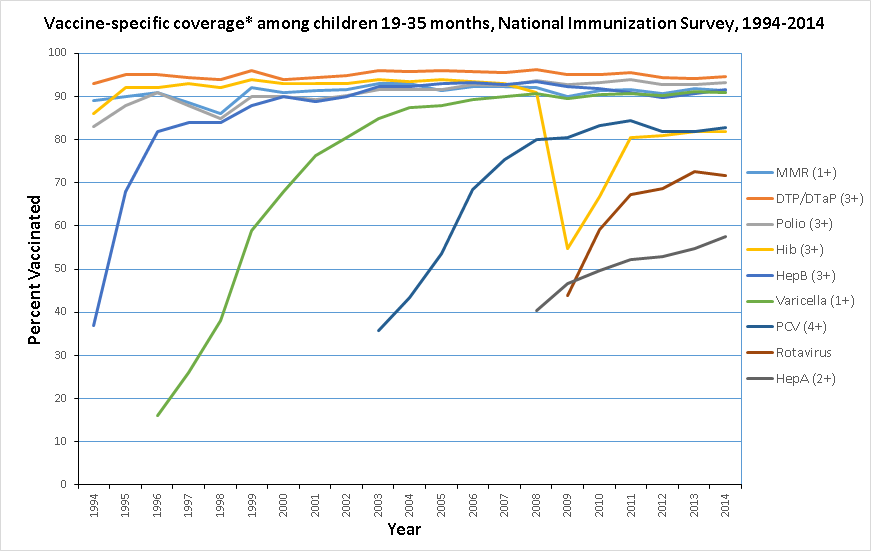
Figure Depicting Coverage with Individual Vaccines from the Inception of NIS, 1994 Through 2014
 ShareCompartir
This website is archived for historical purposes and is no longer being maintained or updated.
August 27, 2015: Content on this page kept for historical reasons.
Vaccine-specific coverage among children 19-35 months, National Immunization Survey, 1994-2014.
Data for this figure
| MMR (1+) | DTP/DTaP (3+) | Polio (3+) | Hib (3+) | HepB (3+) | Varicella (1+) | PCV (4+) | Rotavirus | HepA (2+) | |
|---|---|---|---|---|---|---|---|---|---|
| 1994 | 89 | 93 | 83 | 86 | 37 | ||||
| 1995 | 90 | 95 | 88 | 92 | 68 | ||||
| 1996 | 91 | 95 | 91 | 92 | 82 | 16 | |||
| 1997 | 88.5 | 94.5 | 88 | 93 | 84 | 26 | |||
| 1998 | 86 | 94 | 85 | 92 | 84 | 38 | |||
| 1999 | 92 | 96 | 90 | 94 | 88 | 59 | |||
| 2000 | 91 | 94 | 90 | 93 | 90 | 68 | |||
| 2001 | 91.4 | 94.3 | 89.4 | 93 | 88.9 | 76.3 | |||
| 2002 | 91.6 | 94.9 | 90.2 | 93.1 | 89.9 | 80.6 | |||
| 2003 | 93 | 96 | 91.6 | 93.9 | 92.4 | 84.8 | 35.8 | ||
| 2004 | 93 | 95.9 | 91.6 | 93.5 | 92.4 | 87.5 | 43.4 | ||
| 2005 | 91.5 | 96.1 | 91.7 | 93.9 | 92.9 | 87.9 | 53.7 | ||
| 2006 | 92.3 | 95.8 | 92.8 | 93.4 | 93.3 | 89.2 | 68.4 | ||
| 2007 | 92.3 | 95.5 | 92.6 | 92.6 | 92.7 | 90 | 75.3 | ||
| 2008 | 92.1 | 96.2 | 93.6 | 90.9 | 93.5 | 90.7 | 80.1 | 40.4 | |
| 2009 | 90 | 95 | 92.8 | 54.8 | 92.4 | 89.6 | 80.4 | 43.9 | 46.6 |
| 2010 | 91.5 | 95 | 93.3 | 66.8 | 91.8 | 90.4 | 83.3 | 59.2 | 49.7 |
| 2011 | 91.6 | 95.5 | 93.9 | 80.4 | 91 | 90.8 | 84.4 | 67.3 | 52.2 |
| 2012 | 90.8 | 94.3 | 92.8 | 80.9 | 89.7 | 90.2 | 81.9 | 68.6 | 53 |
| 2013 | 91.9 | 94.1 | 92.7 | 93.7 | 90.8 | 91.2 | 82 | 72.6 | 54.7 |
| 2014 | 91.5 | 94.7 | 93.3 | 82 | 91.6 | 91 | 82.9 | 71.7 | 57.5 |
- Page last reviewed: August 27, 2015 (archived document)
- Content source: