

Statistics
 ShareCompartir
Map of Reported Cases - U.S. 2015
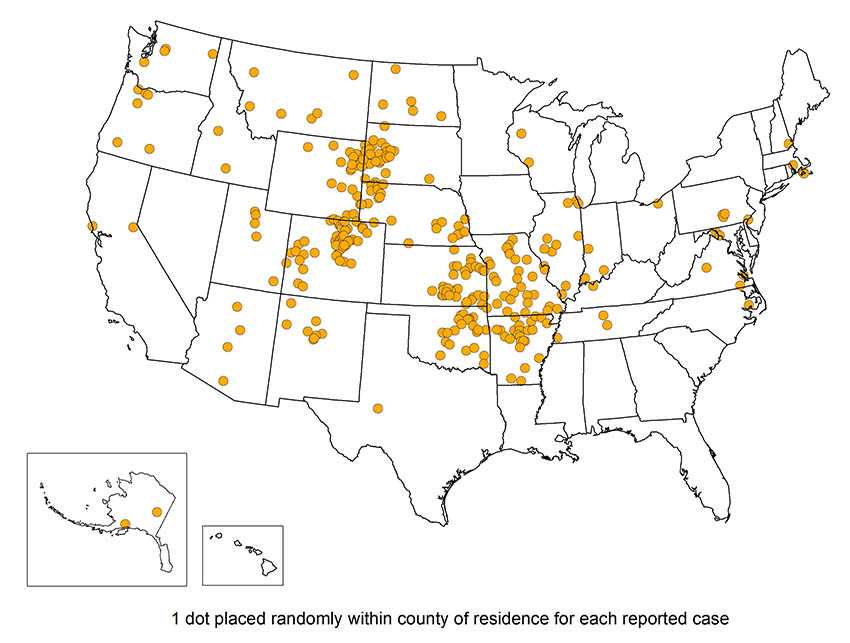
Tularemia has been reported from all states except Hawaii, but is most common in the south central United States, the Pacific Northwest, and parts of Massachusetts, including Martha’s Vineyard.
Table of Reported Cases - U.S. 2005-2015
| State | 2005 | 2006 | 2007 | 2008 | 2009 | 2010 | 2011 | 2012 | 2013 | 2014 | 2015 Cases |
2015 Incidence* |
|---|---|---|---|---|---|---|---|---|---|---|---|---|
| Alabama | 1 | 0 | 0 | 0 | 0 | 0 | 0 | 0 | 0 | 0 | 0 | 0.00 |
| Alaska | 1 | 0 | 1 | 0 | 2 | 0 | 0 | 2 | 1 | 0 | 2 | 0.27 |
| Arizona | 2 | 1 | 3 | 0 | 0 | 1 | 0 | 0 | 0 | 0 | 4 | 0.06 |
| Arkansas | 19 | 6 | 15 | 11 | 17 | 19 | 37 | 22 | 38 | 42 | 24 | 0.81 |
| California | 3 | 5 | 1 | 2 | 1 | 8 | 6 | 2 | 2 | 0 | 2 | 0.01 |
| Colorado | 5 | 3 | 3 | 2 | 3 | 3 | 3 | 1 | 1 | 16 | 52 | 0.95 |
| Connecticut | 0 | 0 | 0 | 0 | 1 | 0 | 0 | 0 | 0 | 0 | 0 | 0.00 |
| Delaware | 0 | 0 | 0 | 0 | 0 | 0 | 1 | 0 | 0 | 0 | 0 | 0.00 |
| Florida | 1 | 0 | 0 | 0 | 1 | 0 | 0 | 0 | 1 | 1 | 0 | 0.00 |
| Idaho | 0 | 1 | 0 | 2 | 0 | 0 | 2 | 1 | 3 | 0 | 2 | 0.12 |
| Illinois | 1 | 1 | 1 | 1 | 3 | 1 | 5 | 4 | 4 | 7 | 10 | 0.08 |
| Indiana | 2 | 0 | 1 | 0 | 1 | 3 | 1 | 4 | 5 | 2 | 3 | 0.05 |
| Iowa | 0 | 1 | 0 | 0 | 1 | 0 | 3 | 1 | 4 | 1 | 0 | 0.00 |
| Kansas | 5 | 7 | 4 | 2 | 4 | 16 | 11 | 22 | 28 | 27 | 34 | 1.17 |
| Kentucky | 3 | 0 | 1 | 2 | 1 | 2 | 1 | 4 | 3 | 1 | 1 | 0.02 |
| Louisiana | 0 | 1 | 0 | 0 | 0 | 0 | 0 | 0 | 0 | 1 | 0 | 0.00 |
| Maryland | 0 | 0 | 1 | 1 | 1 | 0 | 0 | 2 | 2 | 0 | 0 | 0.00 |
| Massachusetts | 12 | 11 | 7 | 19 | 4 | 3 | 8 | 8 | 8 | 3 | 4 | 0.06 |
| Michigan | 2 | 0 | 0 | 0 | 0 | 0 | 0 | 0 | 0 | 2 | 0 | 0.00 |
| Minnesota | 0 | 0 | 1 | 2 | 1 | 0 | 0 | 0 | 0 | 0 | 0 | 0.00 |
| Mississippi | 0 | 0 | 0 | 0 | 0 | 0 | 0 | 0 | 0 | 0 | 0 | 0.00 |
| Missouri | 27 | 14 | 35 | 21 | 13 | 18 | 21 | 27 | 36 | 20 | 29 | 0.48 |
| Montana | 2 | 4 | 0 | 0 | 2 | 1 | 3 | 3 | 5 | 1 | 7 | 0.68 |
| Nebraska | 8 | 7 | 10 | 7 | 5 | 5 | 4 | 6 | 17 | 6 | 25 | 1.32 |
| Nevada | 0 | 1 | 0 | 2 | 0 | 1 | 1 | 1 | 0 | 0 | 0 | 0.00 |
| New Hampshire | 0 | 0 | 1 | 0 | 0 | 1 | 0 | 0 | 0 | 0 | 1 | 0.08 |
| New Jersey | 0 | 0 | 1 | 2 | 2 | 1 | 3 | 0 | 2 | 1 | 1 | 0.01 |
| New Mexico | 2 | 7 | 1 | 1 | 1 | 1 | 7 | 1 | 4 | 5 | 8 | 0.38 |
| New York | 2 | 1 | 1 | 1 | 1 | 0 | 0 | 0 | 0 | 3 | 0 | 0.00 |
| North Carolina | 0 | 1 | 1 | 3 | 1 | 3 | 0 | 1 | 2 | 0 | 1 | 0.01 |
| North Dakota | 0 | 2 | 0 | 3 | 0 | 1 | 2 | 3 | 0 | 4 | 5 | 0.66 |
| Ohio | 1 | 0 | 0 | 0 | 1 | 0 | 1 | 0 | 2 | 1 | 1 | 0.01 |
| Oklahoma | 20 | 3 | 18 | 7 | 7 | 8 | 15 | 17 | 10 | 17 | 23 | 0.59 |
| Oregon | 2 | 4 | 3 | 4 | 1 | 3 | 5 | 0 | 3 | 4 | 6 | 0.15 |
| Pennsylvania | 2 | 1 | 0 | 0 | 1 | 1 | 1 | 0 | 0 | 0 | 3 | 0.02 |
| South Carolina | 1 | 0 | 0 | 0 | 0 | 0 | 0 | 0 | 0 | 0 | 0 | 0.00 |
| South Dakota | 8 | 5 | 7 | 10 | 5 | 11 | 8 | 5 | 7 | 5 | 25 | 2.91 |
| Tennessee | 9 | 0 | 2 | 2 | 4 | 3 | 3 | 2 | 4 | 2 | 3 | 0.05 |
| Texas | 1 | 0 | 1 | 0 | 0 | 1 | 0 | 0 | 1 | 0 | 1 | 0.00 |
| Utah | 1 | 3 | 9 | 8 | 0 | 2 | 1 | 2 | 2 | 1 | 5 | 0.17 |
| Vermont | 0 | 0 | 0 | 0 | 1 | 0 | 0 | 0 | 0 | 1 | 0 | 0.00 |
| Virginia | 0 | 0 | 3 | 1 | 0 | 1 | 6 | 2 | 2 | 0 | 4 | 0.05 |
| Washington | 9 | 1 | 1 | 4 | 5 | 3 | 5 | 5 | 5 | 4 | 4 | 0.06 |
| West Virginia | 0 | 1 | 0 | 0 | 0 | 0 | 0 | 0 | 0 | 1 | 1 | 0.05 |
| Wisconsin | 0 | 0 | 0 | 1 | 0 | 0 | 1 | 0 | 1 | 0 | 2 | 0.03 |
| Wyoming | 2 | 3 | 4 | 2 | 2 | 3 | 1 | 1 | 0 | 1 | 21 | 3.58 |
| U.S. TOTAL | 154 | 95 | 137 | 123 | 93 | 124 | 166 | 149 | 203 | 180 | 314 | 0.10 |
|
*Incidence= reported cases per 100,000 residents |
||||||||||||
Yearly Reported Cases - U.S. 1950-2015
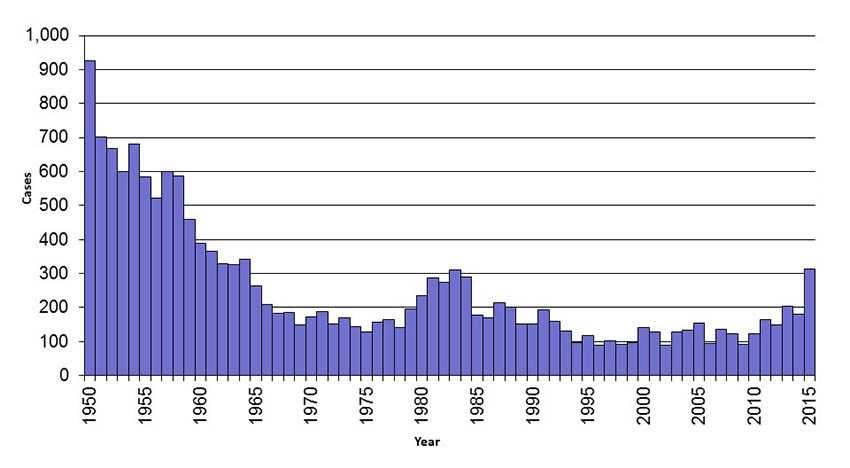
Tularemia was much more common in the early part of the 20th century than it is now.
Age & Sex Reported Cases - U.S. 2001-2015
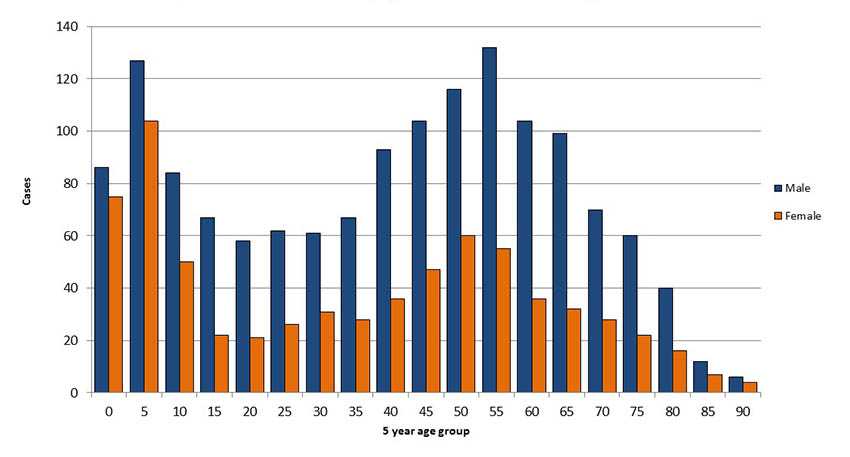
Tularemia is more common in males, possibly because of a greater likelihood of exposure through hunting and landscaping. Tularemia occurs in persons of all ages, but is most common in children.
Monthly Reported Cases - U.S. 2001-2015
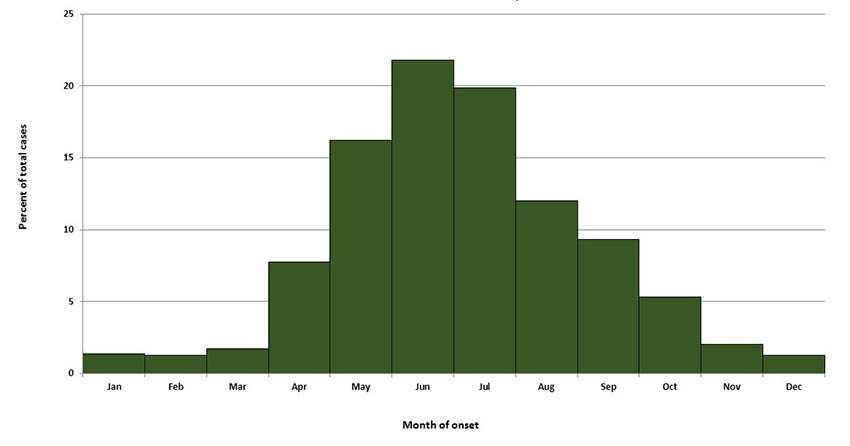
Tularemia is more common in the months of May through September. Bites from infected ticks or deer flies usually occur in the summer months, but illness due to animal handling and hunting can occur at any time of the year.
- Page last reviewed: November 29, 2016
- Page last updated: November 29, 2016
- Content source: