RSV National Trends
![]() Participating laboratories report weekly to CDC the total number of RSV tests performed that week, and the number of those tests that were positive. Because reporting delays may be expected for some laboratories, data shown for the more recent weeks may be less complete than others. The trend graph below displays the weekly national average percent of diagnostic tests positive for RSV among all the diagnostics performed to detect RSV, as reported by participating laboratories.
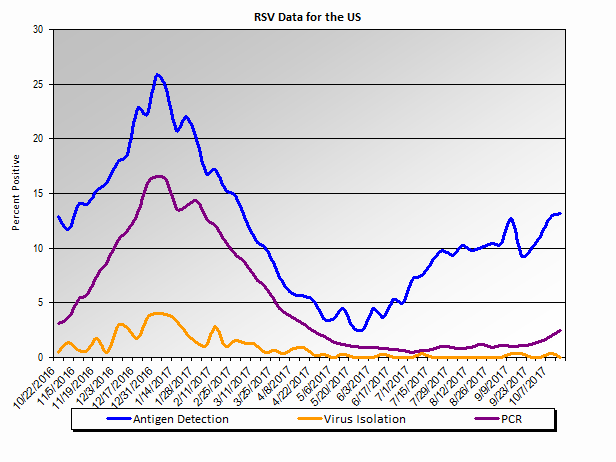
Participating laboratories report weekly to CDC the total number of RSV tests performed that week, and the number of those tests that were positive. Because reporting delays may be expected for some laboratories, data shown for the more recent weeks may be less complete than others. The trend graph below displays the weekly national average percent of diagnostic tests positive for RSV among all the diagnostics performed to detect RSV, as reported by participating laboratories.
Respiratory Syncytial Virus (RSV)

Table: percent positive respiratory syncytial virus tests in the United States, by week
Top of Page- Page last reviewed: February 27, 2017
- Page last updated: February 27, 2017
- Content source:


 ShareCompartir