

Figure 54. Herpes Simplex Virus Type 2 — Seroprevalence Among Non-Hispanic Whites and Non-Hispanic Blacks by Sex and Age Group, National Health and Nutrition Examination Surveys, 1988–1994, 1999–2002, 2003–2006, and 2007–2010
 ShareCompartir
This web page is archived for historical purposes and is no longer being updated. Newer data is available on the
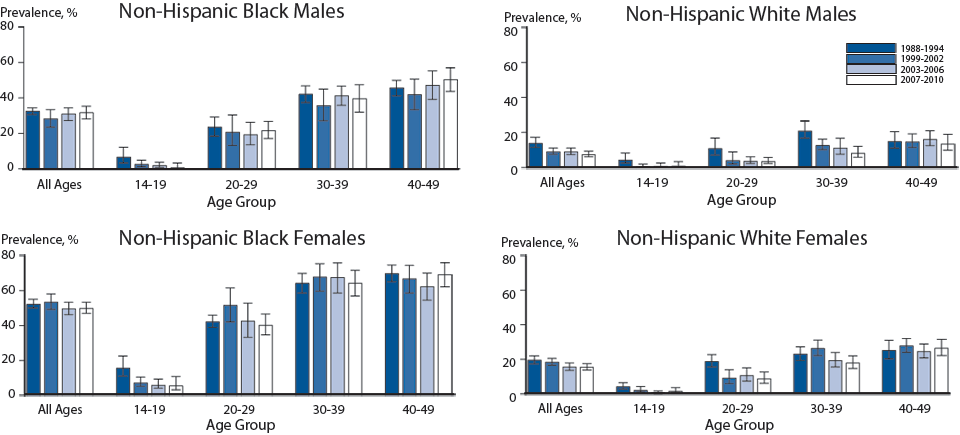
NOTE: Error bars indicate 95% confidence interval.
SOURCE: Fanfair RN, Zaidi A, Taylor LD, Xu F, Gottlieb S, Markowitz L. Trends in seroprevalence of herpes simplex virus type 2 among non-Hispanic blacks and non-Hispanic whites aged 14 to 49 years —— United States, 1988 to 2010. Sex Transm Dis. 2013;40(11):860–4
- Page last reviewed: December 16, 2014 (archived document)
- Content source: