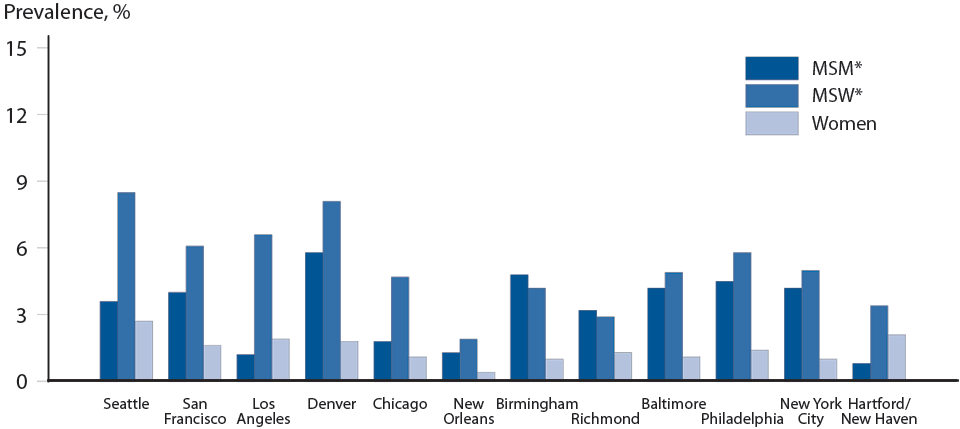
Figure 52. Genital Warts — Prevalence Among STD Clinic Patients by Sex, Sex of Partners, and Site, STD Surveillance Network (SSuN), 2013
This web page is archived for historical purposes and is no longer being updated. Newer data is available on the

*MSM = men who have sex with men; MSW = men who have sex with women only.
NOTE: In 2013, six jurisdictions (Birmingham, Chicago, Denver, Hartford/New Haven, New Orleans, and Richmond) contributed data from January through June 2013 and the remaining jurisdictions (Baltimore, Los Angeles, New York City, Philadelphia, San Francisco and Seattle) contributed data for all of 2013.
- Page last reviewed: December 16, 2014 (archived document)
- Content source:


 ShareCompartir