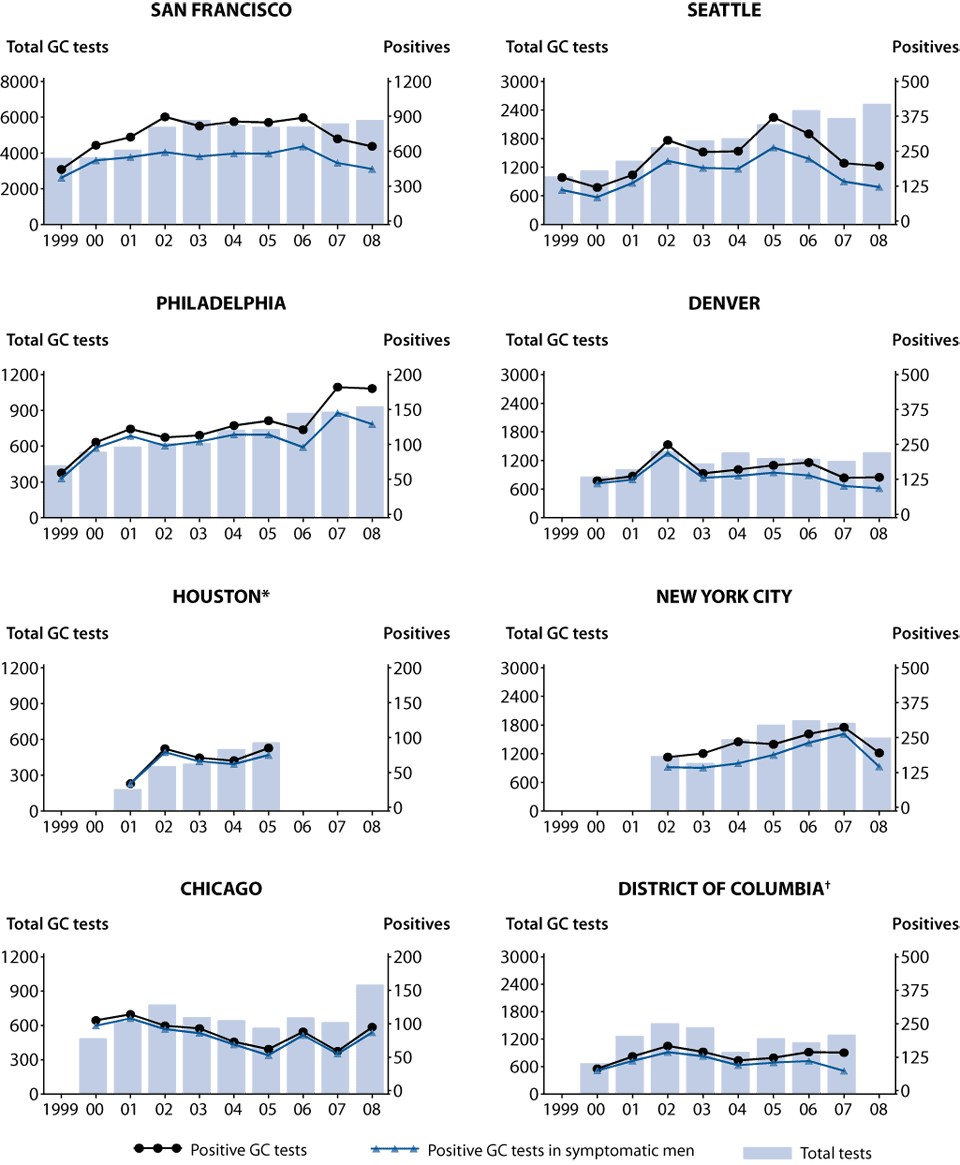
Figure W. MSM Prevalence Monitoring Project—Number of gonorrhea tests and number of positive tests in men who have sex with men, STD clinics, 1999–2008
This web page is archived for historical purposes and is no longer being updated. Newer data is available on the STD Data and Statistics page.

* Data not reported in 2006, 2007, or 2008.
† Data not reported in 2008.
NOTE: The bars represent the number of total GC tests and the lines represent the number of positive tests considering all anatomic sites (pharyngeal, rectal, and urethral) each year. The scales on the left and right axis differ. The bar graphs use the scale on the left. The line graphs use the scale on the right.
- Page last reviewed: November 16, 2009 (archived document)
- Content source:


 ShareCompartir