

Figure 48. Genital herpes—Herpes simplex virus, type 2, seroprevalence in non-Hispanic whites and non-Hispanic blacks by age group from national surveys, 1976–1980, 1988–1994, 1999–2004
 ShareCompartir
This web page is archived for historical purposes and is no longer being updated. Newer data is available on the STD Data and Statistics page.
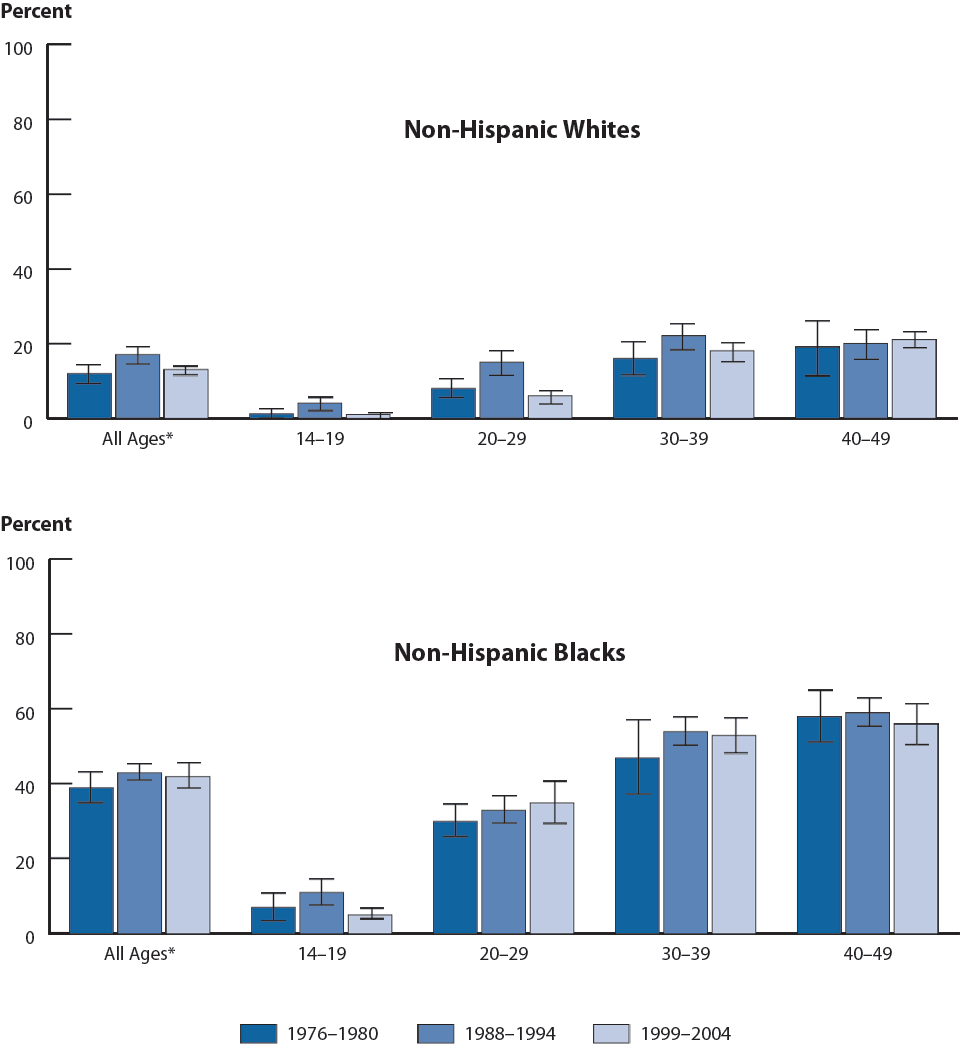
* Age-adjusted using the 2000 U.S. Census civilian, noninstitutionalized population aged 14 to 49 years as the standard.
NOTE: Error bars indicate 95% confidence intervals.
SOURCE: National Health and Nutrition Examination Survey. JAMA 2006;296:964–973. © 2006 American Medical Association. All rights reserved.
- Page last reviewed: November 16, 2009 (archived document)
- Content source: