

Epidemiology and Statistics
 ShareCompartir
Q fever was first recognized as a human disease in Australia in 1935 and in the United States in the early 1940’s. The “Q” stands for “query” and was applied at a time when the cause was unknown. Q fever is caused by infection with the bacteria C. burnetii. Cattle, sheep, and goats are commonly infected and people often become exposed by breathing in dust contaminated from infected animal body fluids. Persons in direct contact with animals during birthing, such as veterinarians and farmers may be at higher risk for infection. C. burnetii can survive for long periods of time in the environment and may be carried long distances by wind.
Q Fever in the United States
Q fever was made a nationally notifiable disease in the United States in 1999. CDC compiles the number of cases reported by state and local health departments and reports national trends. The number of Q fever cases reported to CDC has increased, from 19 cases reported in 2000, to 173 cases reported in 2007. In 2008 the Q fever case definition was changed to allow for the reporting of chronic and acute Q fever separately. During 2008–2013, the number of reported cases decreased slightly, relative to 2007, returning to high levels in 2014. One hundred seventy-six cases of Q fever were reported in 2014; of these, 137 were acute Q fever and 39 were chronic Q fever.
Figure 1 – Number of U.S. Q Fever cases* reported to CDC, 2000 – 2014.
*Numbers presented here may differ from numbers presented in the MMWR Annual Summary of Notifiable Diseases. Data presented here are based on year of illness onset rather than reporting year.
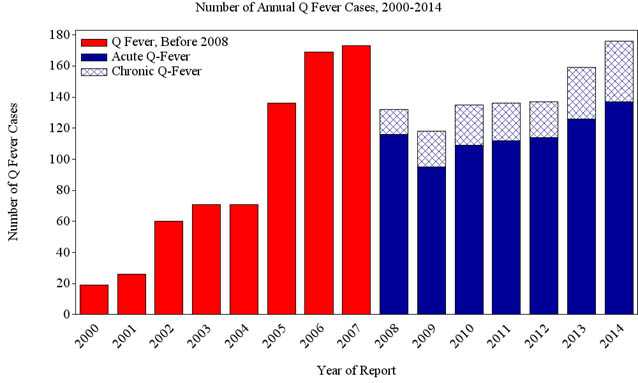
Number of annual Q fever cases 2000 – 2014:
The graph displays the number of human cases of Q fever reported to CDC annually from 2000 through 2014. Cases of Q fever increased steadily from 19 cases in 2000 when the disease became nationally notifiable, to 173 in 2007. Cases decreased significantly in 2008–2013 relative to 2007, with total cases returning to high levels in 2014. Beginning in 2008, cases were differentiated as acute or chronic. Acute cases generally make up 75-90% of cases reported.
Hospitalization Rates
Q fever infection, especially chronic Q fever, may be severe with complications requiring hospitalization that may include endocarditis (infection of the heart tissue), encephalitis (inflammation of the central nervous system), pneumonia (inflammation of the lungs), hepatitis (inflammation of the liver), and splenomegaly (enlargement of the spleen). Between 2002-2014 over 50% of cases required hospitalization. However, it is likely that mild Q fever infections which do not require hospitalization are more likely to be unrecognized and therefore may not be reported.
Figure 2 – Hospitalization rates, U.S. Q fever cases reported to CDC, 2002–2014.
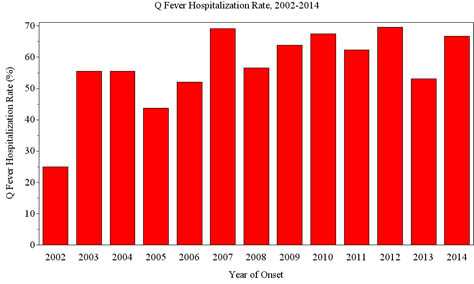
Q fever hospitalization rates, 2002 – 2014:
This figure shows the proportion of hospitalized cases among cases reported to CDC between 2002 and 2014. The lowest rate of hospitalization was in 2002 at 25%. Highest proportions of hospitalized cases were reported in 2007 and 2012, both of which reported hospitalization rates of roughly 70%.
| Year | Hospitalization Rate |
|---|---|
| 2002 | 25% |
| 2003 | 56% |
| 2004 | 56% |
| 2005 | 44% |
| 2006 | 52% |
| 2007 | 69% |
| 2008 | 57% |
| 2009 | 66% |
| 2010 | 65% |
| 2011 | 62% |
| 2012 | 71% |
| 2013 | 53% |
| 2014 | 68% |
Geography
The number of cases of Q fever per million persons varies state by state, with cases most frequently reported from western and plains states where ranching and rearing of livestock are common. More than one third of cases (35%) are reported from four states (California, Texas, Colorado, and Illinois). Sporadic reports of cases may result from patients with travel to other states or countries.
Figure 3 – Annual reported incidence (per million population) for Q fever in the United States for 2014.
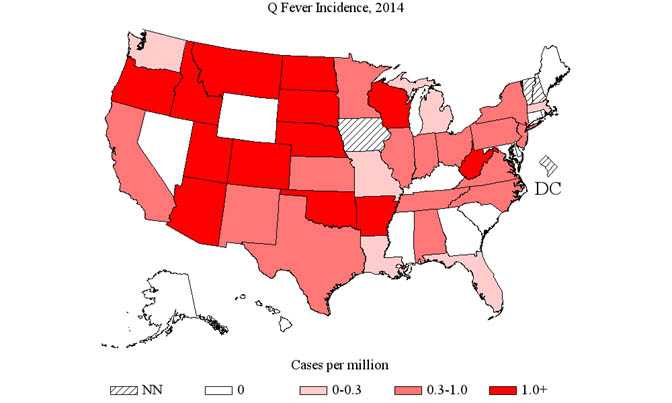
Geographic distribution of Q fever incidence in 2014:
This figure shows the incidence (number of cases per million persons) of Q fever cases by state in 2014. Q fever was not notifiable in Iowa, New Hampshire, and Vermont and the District of Columbia in 2014. The incidence rate was zero for Alaska, Connecticut, Delaware, Georgia, Hawaii, Kentucky, Maine, Maryland, Mississippi, Nevada, Rhode Island, South Carolina and Wyoming. Incidence was greater than zero and less than 0.4 cases per million persons for Florida, Illinois, Indiana, Louisiana, Massachusetts, Michigan, Missouri, North Carolina, Ohio, Tennessee, and Washington. Annual incidence was at least 0.4 and less than 1.0 case per million persons in Alabama, California, Kansas, Minnesota, New Jersey, New Mexico, New York, Oklahoma, Pennsylvania, Texas, Virginia and Wisconsin. The highest incidence rates, at least 1.0 case per million persons were found in Arizona, Arkansas, Colorado, Idaho, Montana, Nebraska, North Dakota, Oregon, South Dakota, Utah and West Virginia.
Seasonal trends
Although cases of Q fever can occur during any month of the year, most cases report illness beginning in the spring and early summer months, peaking in April and May. These increases coincide with increases in outdoor activity, and with the birthing season for a number of domestic animal species.
Figure 4 – Percent of Q fever cases reported to CDC by month of onset, 2000–2014.
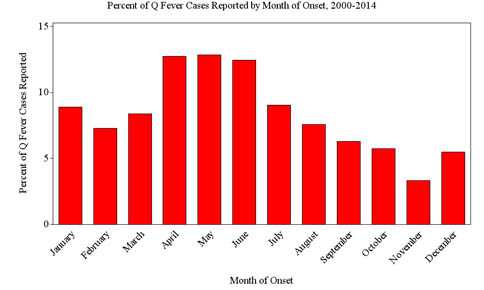
Percent of Q fever cases reported each month of onset 2000–2014:
This figure shows the percent of cases reported from 1998 through 2014 by month of onset to give the seasonality of cases. There are cases reported in each month of the year, ranging from 3% reported in November, to 13% of cases reported in April and May. November is the only month in which less than 5% of cases are reported.
People at Risk
More cases of Q fever are reported in persons of older age. Cases are also more likely to be male; however, jobs at high risk for Q fever exposure, just as ranching or livestock management, may be more commonly held by men. People who live or spend time near ranches and livestock facilities are at increased risk for Q fever infection. Studies have shown that persons with a history of heart valve defects, endocarditis, or heart valve implants may increase the risk of chronic infection and severe disease.
Figure 5 – Average annual incidence of Q Fever by age group, 2000 – 2014
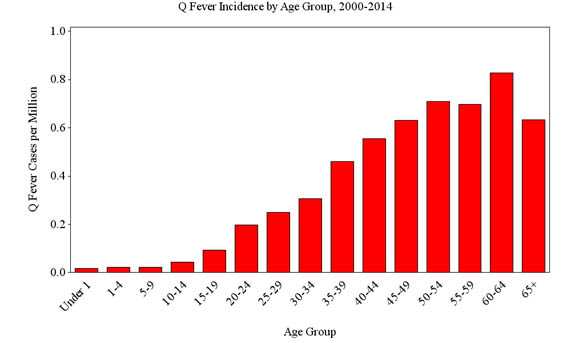
Q Fever Incidence by Age Group, 2000 – 2014
This figure shows the average annual incidence of Q fever per million persons by age groups for 2000 through 2014. The graph shows that cases have been reported in every age group with increased incidence as age increases. The highest rate of incidence, roughly 0.8 cases per million persons, is seen in persons ages 60–64 years.
- Page last reviewed: October 23, 2016
- Page last updated: October 23, 2016
- Content source: