

Trichinellosis Graphs
 ShareCompartir
Number of reported cases of trichinellosis, by year, 1947–2015*
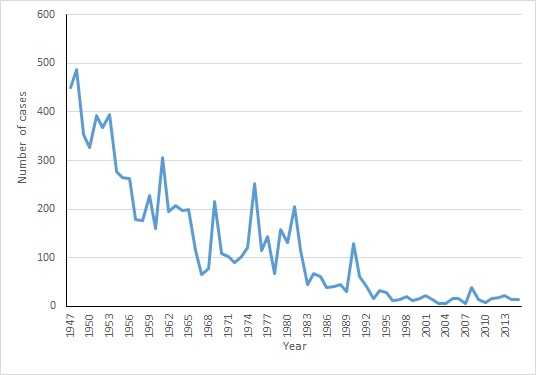
* Year as reported by health department
Number of reported cases of trichinellosis, by age group, 2011–2015*
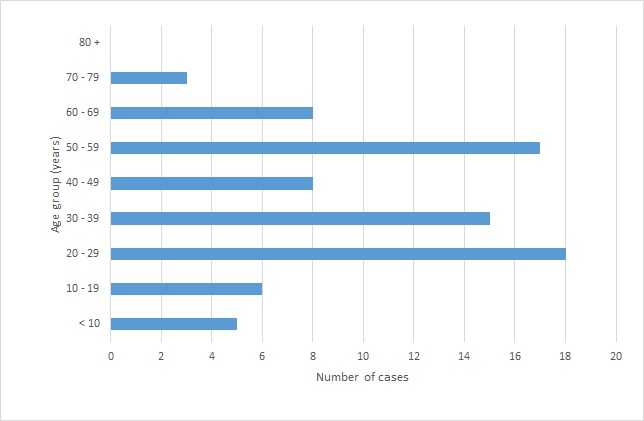
* Year as reported by health department
† N = 80
- Page last reviewed: July 5, 2017
- Page last updated: July 5, 2017
- Content source: