

Babesiosis Graphs
 ShareCompartir
Number of reported cases of babesiosis, by year, 2011–2014*
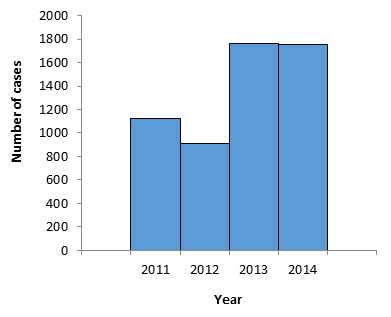
* Year as reported by the health department
- For 2014, CDC was notified of a total of 1,744 U.S. cases of babesiosis, a 1% decrease from the total of 1,761 cases for 2013.
Number of reported cases of babesiosis, by age group and year, 2011–2014*
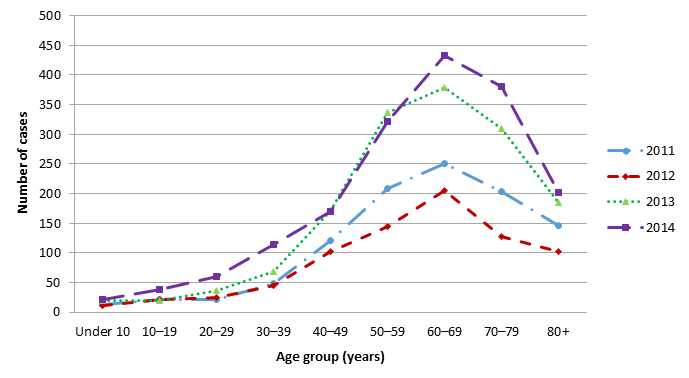
* Data on age were available for most case-patients (2011, n = 1,034/1,126; 2012, n = 785/911; 2013, n = 1,523/1,761; 2014, n = 1,741/1,744).
- The age distributions for 2014 and the 3 previous years were similar, with the largest number of cases reported in persons aged 60–69 years.
Number of reported cases of babesiosis, by month and year of symptom onset, 2011–2014
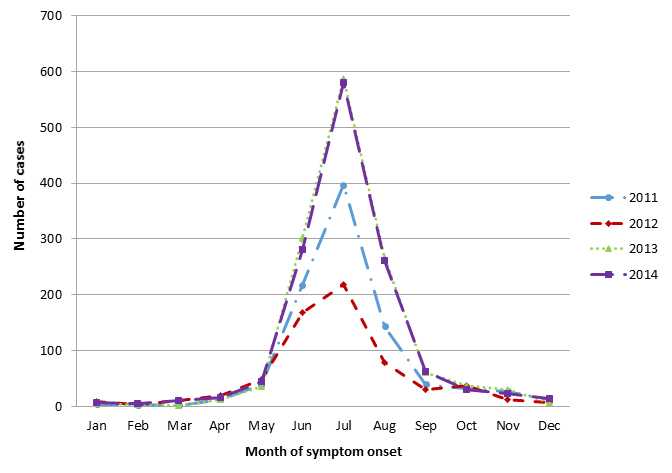
- Although cases of babesiosis can occur during any month, a majority of case-patients have reported getting sick during the spring or summer months.
- The proportion of case-patients with reported symptom onset during June–August has remained fairly consistent from year to year: 81% for 2011 (n = 759/932); 72% for 2012 (n = 464/644); 86% for 2013 (n = 1,156/1,352); and 84% for 2014 (n = 1,124/1,340).
- Data on month of symptom onset were available for most case-patients (overall, n = 4,268/5,542; 2011, n = 932/1,126; 2012, n = 644/911; 2013, n = 1,352/1,761; 2014, n = 1,340/1,744).
Hospitalization data for babesiosis case-patients, all years combined, 2011–2014*
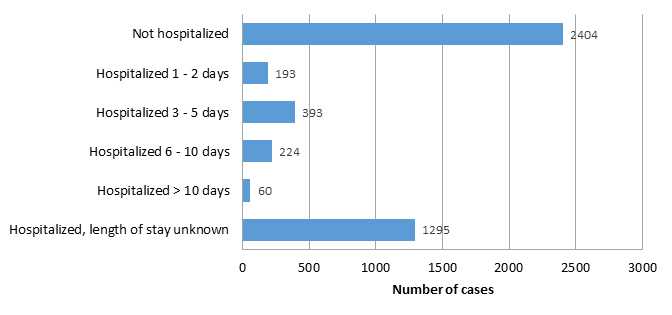
* Hospitalization data were available for 4,569 case-patients (82% of the total of 5,542 for 2011–2014), 2,165 of whom (47% of 4,569) reportedly had been hospitalized for at least 1 day. The median length of the hospital stay was 4 days (range: 1–39 days) among the 870 case-patients with available data.
- Page last reviewed: October 17, 2016
- Page last updated: October 17, 2016
- Content source: