

Get the Facts: Sugar-Sweetened Beverages and Consumption
 ShareCompartir
Sugar-sweetened beverages (SSBs) or sugary drinks are leading sources of added sugars in the American diet. Frequently drinking sugar-sweetened beverages is associated with weight gain/obesity, type 2 diabetes, heart disease, kidney diseases, non-alcoholic liver disease, tooth decay and cavities, and gout, a type of arthritis.1-4 Limiting the amount of SSB intake can help individuals maintain a healthy weight and have a healthy diet.
What are sugar-sweetened beverages?
- Sugar-sweetened beverages are any liquids that are sweetened with various forms of added sugars like brown sugar, corn sweetener, corn syrup, dextrose, fructose, glucose, high-fructose corn syrup, honey, lactose, malt syrup, maltose, molasses, raw sugar, and sucrose.5
- Examples of SSBs include, but are not limited to regular soda (not sugar-free), fruit drinks, sports drinks, energy drinks, sweetened waters, and coffee and tea beverages with added sugars.5
SSB consumption varies by age, sex, race/ethnicity, geography and socioeconomic status.
- In 2011-2014, 6 in 10 youth (63%) and 5 in 10 adults (49%) drank a sugar-sweetened beverage on a given day. On average, U.S. youth consume 143 calories from SSBs and U.S. adults consume 145 calories from SSBs on a given day.6,7
- Among youth, SSB intake is higher among boys, adolescents, non-Hispanic blacks, or youth living in low-income family.6, 8
- Among adults, SSB intake is higher among males, young adults, non-Hispanic blacks or Mexican American, or low-income adults.7, 8
- The prevalence of Americans who drink SSB at least once per day differs geographically. For example, 68% among adults living in the Northeast, 67% among adults living in the South, 61% among adults living in the West, and 59% among adults living in the Midwest reported drinking SSBs one or more times per day.9
- Americans drink 52% of SSB calories at home and 48% of SSB calories away from home.10
SSB consumption is associated with less healthy behaviors.
Adults and adolescents who smoke, don’t get enough sleep, don’t exercise much, eat fast food often and who do not eat fruit regularly are more likely to be frequent consumers of SSBs. Additionally, adolescents who frequently drink SSBs also have more screen time (e.g., television, cell phones, computers, video games).11-13
Prevalence of adults reported drinking SSBs at least once a day
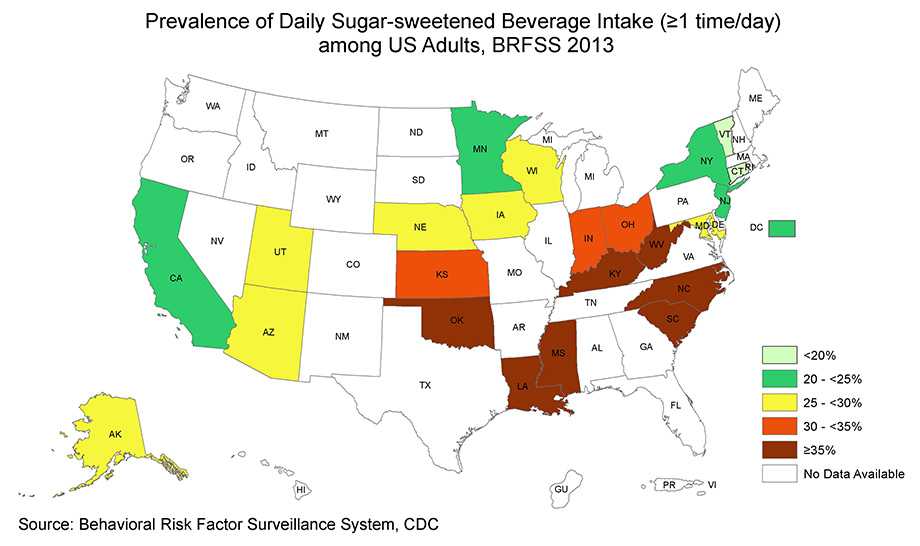
- In only 2 states out of 23 states and DC surveyed, less than 20% of adults were daily SSB consumers.
- In 4 states and DC out of 23 states and DC surveyed, 20% to less than 25% of adults were daily SSB consumers.
- In 7 states out of 23 states and DC surveyed, 25% to less than 30% of adults were daily SSB consumers.
- In 3 states out of 23 states and DC surveyed, 30% to less than 35% of adults were daily SSB consumers.
- In 7 states out of 23 states and DC surveyed, 35% or more of adults were daily SSB consumers.
Resources
- A Data User’s Guide to the BRFSS Sugar-Sweetened Beverage Questions: How to Analyze Consumption of Sugar-Sweetened Beverages [PDF-376KB]
- Rethink Your Drink: Options for reducing the number of calories you drink
- CDC Podcast: Sugary Drinks; Curb the Colas
CDC Publications
Youth
- Trends in beverage consumption among high school students – United States, 2007–2015; February 2017
- District policies and practices vary in their association with adolescents’ consumption of milk and 100% fruit juice; January 2017
- School district policies and adolescents’ soda consumption; July 2016
- Child and caregiver attitudes about sports drinks and weekly sports drink intake among U.S. youth; January 2016
- Self-reported advertising exposure to sugar-sweetened beverages among U.S. youth; May 2015
- Mothers’ child-feeding practices are associated with children’s sugar-sweetened beverage intake; April 2015
- The association of sugar-sweetened beverage intake during infancy with sugar-sweetened beverage intake at 6 years of age; September 2014
- A longitudinal analysis of sugar-sweetened beverage intake in infancy and obesity at 6 years; September 2014
Adults
- Physician characteristics associated with sugar-sweetened beverage counseling practices; December 2016
- Permanent tooth loss and sugar-sweetened beverage intake in U.S. young adults; November 2016
- Association of sugar-sweetened beverage intake frequency and asthma among U.S. adults, 2013; October 2016
- Prevalence of sugar-sweetened beverage intake among adults — 23 States and the District of Columbia, 2013; February 2016
- Knowledge of sugar content of sports drinks is not associated with sports drink consumption; November-December 2015
- Association between sugar-sweetened beverage intake and proxies of acculturation among U.S. Hispanic and non-Hispanic white adults; 2015
- Sugar-sweetened beverage consumption among adults – 18 States, 2012; August 2014
- The relationship between health-related knowledge and sugar-sweetened beverage intake among U.S. adults; July 2014
References
- Malik V, Popkin B, Bray G, Desprs J-P, Hu F. Sugar-sweetened beverages, obesity, type 2 diabetes mellitus, and cardiovascular disease risk. Circulation. 2010;121(11):1356-1364.
- Malik VS, Hu FB. Fructose and Cardiometabolic Health: What the Evidence From Sugar-Sweetened Beverages Tells Us. J Am Coll Cardiol. 2015;66(14):1615-1624.
- Bomback A, Derebail V, Shoham D, et al. Sugar-sweetened soda consumption, hyperuricemia, and kidney disease. Kidney International. 2010;77(7):609-616.
- Bernabe E, Vehkalahti MM, Sheiham A, Aromaa A, Suominen AL. Sugar-sweetened beverages and dental caries in adults: a 4-year prospective study. J Dent. 2014;42(8):952-958.
- U.S. Department of Agriculture, U.S. Department of Health and Human Services. Dietary Guidelines for Americans, 2015-2020. 8th Edition ed. Washington, DC: U.S. Government Printing Office; 2015. Accessed March 8, 2016.
- Rosinger A, Herrick K, Gahche J, Park S. Sugar-sweetened beverage consumption among U.S. youth, 2011–2014. NCHS Data Brief. No 271. Hyattsville, MD: National Center for Health Statistics. 2017.
- Rosinger A, Herrick K, Gahche J, Park S. Sugar-sweetened beverage consumption among U.S. adults, 2011–2014. NCHS Data Brief. No 270. Hyattsville, MD: National Center for Health Statistics. 2017.
- Ogden CL, Kit BK, Carroll MD, Park S. Consumption of sugar drinks in the United States, 2005-2008. NCHS Data Brief. 2011(71):1-8.
- Park S, McGuire LC, Galuska DA. Regional differences in sugar-sweetened beverage intake among US adults. J Acad Nutr Diet. 2015;115(12):1996-2002.
- Kit BK, Fakhouri TH, Park S, Nielsen SJ, Ogden CL. Trends in sugar-sweetened beverage consumption among youth and adults in the United States: 1999-2010. Am J Clin Nutr. 2013;98(1):180-188.
- Park S, Blanck HM, Sherry B, Brener N, O’Toole T. Factors associated with sugar-sweetened beverage intake among United States high school students. J Nutr. 2012;142(2):306-312.
- Park S, Sherry B, Foti K, Blanck HM. Self-reported academic grades and other correlates of sugar-sweetened soda intake among US adolescents. J Acad Nutr Diet. 2012;112(1):125-131.
- Park S, Pan L, Sherry B, Blanck HM. Consumption of sugar-sweetened beverages among US adults in 6 states: Behavioral Risk Factor Surveillance System, 2011. Prev Chronic Dis. 2014;11:E65.
- Page last reviewed: February 27, 2017
- Page last updated: April 7, 2017
- Content source: