HIGHWAY WORK ZONE SAFETY
Construction Equipment Visibility
Test Procedure
Method
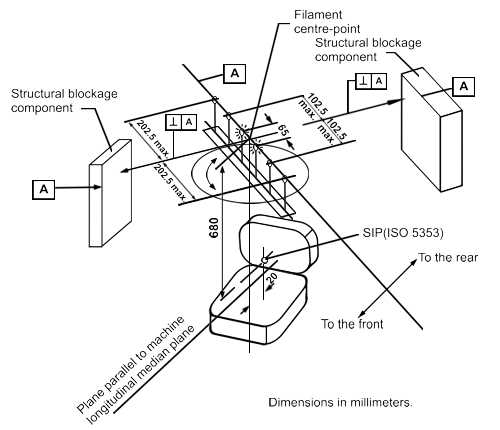
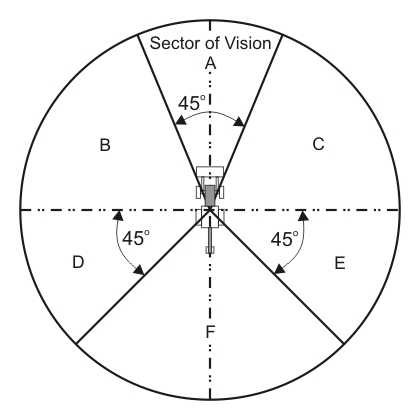
A combination of physical measurements and computer simulation were used to generate the blind area diagrams. Both methods utilized ISO 5006 “Earth-Moving Machinery – Operator’s Field of View Part 1: Test Method” test procedure, which uses light sources to represent the operator’s eyes. The eye point was representative of the 50th percentile worldwide operator as defined in ISO 3411 “Earth-Moving Machinery – Human Physical Dimensions of Operators and Minimum Operator Space Envelope” and was 680 mm above and 20 mm in front of the Seat Index Point (SIP) as defined in ISO 5353 “Earth-Moving Machinery, and Tractors and Machinery for Agriculture and Forestry – Seat Index Point” (see Figure 1). Light source horizontal spacings as defined in ISO 5006 for the various sectors of vision around the machine, shown in Figure 2, were used for mapping the shadows, which represent the visibility blind areas. These spacings represent the ability of an operator to move his head laterally to see around visibility blockages.
Blind areas were determined for three planes of elevation; the ground plane, a plane at 900 mm above ground to correspond to the height of channelizing devices, and a plane at 1500 mm above ground to correspond to the height of a 4′ 11″ person. The 1500 mm above ground plane also corresponds to a height that is slightly less than the stature of the 5th percentile operator as defined in ISO 3411. Polar plots of the recorded data were generated with 5-degree increments and 1-meter intervals up to the 12-meter or 24-meter test circle perimeter, depending on machine size.
The indirect visibility, through the use of mirrors, was measured using a single light source in accordance with ISO/CD 14401-1 “Earth-Moving Machines – Surveillance and Rear-View Mirrors, Field of Vision – Part 1 – Test Method.”

Figure 1. Arrangement of the test equipment.

Figure 2. Visibility test sectors.
- Page last reviewed: June 20, 2017
- Page last updated: October 15, 2008
- Content source:
- National Institute for Occupational Safety and Health Division of Safety Research


 ShareCompartir