Worker Health Study Summaries
Research on long-term exposure
Cadmium Recovery Workers (Cadmium)
1991
Kidney Study Background
In 1985, NIOSH did a study to look at the kidneys of cadmium workers. 45 current and former workers took part. This study is completely different from the mortality study that NIOSH did.
Even if you were not in the kidney study, the findings probably apply to you and other cadmium workers.
Why the Kidney Study Was Done
Studies at many companies had shown that exposure to cadmium can damage the kidneys.
It is not known exactly how much cadmium exposure it takes to cause kidney damage.
NIOSH wanted more information on the association of cadmium exposure and kidney damage.
How the Kidney Study Was Done
NIOSH chose to do a medical exam. It is a more accurate way of looking for kidney damage than doing a mortality study. A death certificate may not list kidney disease even if the person had it for a long time.
In 1985, NIOSH doctors examined 45 current and former cadmium workers. The exam included blood and urine samples.
NIOSH also examined 32 hospital workers who had not been exposed to cadmium. The purpose was to see if cadmium workers had signs of kidney damage that the other workers didn’t.
What the Kidney Study Found
The final NIOSH report on this study came out in 1988.
The study found that cadmium workers had more cadmium in their blood and in their urine than hospital workers.
8 of 45 (18%) cadmium workers had kidney stones. 1 of 32 (3%) hospital workers had kidney stones.
It found signs that the kidneys of cadmium workers were not working as well as they should be.
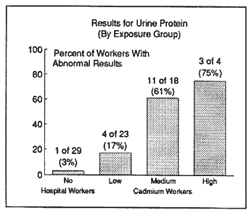
For example, 18 of 45 (40%) cadmium workers had too much protein in their urine. Only 1 out of 29 (3%) hospital workers had too much protein in their urine.
Protein in the urine is a typical finding in people exposed to too much cadmium.
What Does the Kidney Study Mean?
We are concerned because the study shows that kidney damage due to cadmium exposure was occurring. On the other hand, the kidney damage seen in most workers was relatively mild.
It is difficult to explain the meaning of the kidney findings. For most workers, even though the kidneys were damaged, they were working all right. This is probably because humans have a lot more kidney than they need.
People don’t feel any different if their urine has small extra amounts of protein or cadmium.
The kidney is an important organ. We know that it is important to stop kidney damage while it is still mild.
One reason to stop kidney damage is that once the kidney is damaged, it may never return to normal. We saw this in cadmium workers who showed signs of kidney damage even though they had not worked at the plant for over 5 years.
Some medical tests tell whether damage occurred recently. This would help us tell whether current exposure levels are a problem. NIOSH didn’t find any evidence of recent kidney damage.
Charts for the Kidney Study
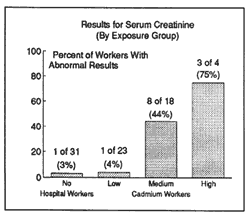
The charts show the results for two medical tests.
Chart 1 shows the results for urine protein.

Chart 2 shows the results for a substance in blood, serum creatinine. Both tests are done to see how well the kidneys work.

Both charts show the results by exposure group. The hospital workers are considered to have no exposure to cadmium. The cadmium workers are divided into the low, medium, and high cadmium exposure groups.
The results are shown as the number and percent of the workers in each exposure group who had abnormal medical test results.
Thus, for each group, the percent of workers with normal results could range from 0% (no workers had abnormal results) to 100% (all workers had abnormal results).
The charts clearly show that the percent of workers with abnormal results goes up as cadmium exposure goes up.
With urine protein, even the low exposure group showed an increase over hospital workers.
Kidney Summary
Many cadmium workers (especially in the medium and high exposure groups) showed some signs of kidney damage.
However, this damage may not be enough to cause actual illness because mild damage may not be noticeable. But any damage is of concern because we don’t know enough about how it affects the whole body. Exposure in recent years may not have been high enough to cause serious kidney damage.
Background of the NIOSH Cadmium Mortality Study
The NIOSH cadmium mortality study helped us learn more about the hazards of cadmium exposure. This information will help workers exposed to cadmium around the world.
Why the Cadmium Mortality Study Was Done
The purpose of the study was to see whether exposure to cadmium was associated with increased death rates in workers when compared to the general population.
How the Cadmium Mortality Study Was Done
NIOSH conducted an initial mortality study and 2 updates. Mortality means that the study looked at causes of death.
The study took place between 1976 and 1986. It included a total of 625 production workers (current and former). They all had worked between 1940 and 1969. They may have worked before 1940 or after 1969, too.
This kind of study is done without contacting the individual worker because it is based on records. The study did not involve medical exams. It included living and deceased workers.
We used government records to find out which workers had died. Death certificates reported the cause of death. NIOSH used public records to find out the death rate for certain diseases in the general population. NIOSH used work histories and cadmium air measurements to estimate how much cadmium each worker had been exposed to through 1976.
NIOSH compared the death rates in workers exposed to cadmium to the death rates in the public. We did this for many diseases. When the death rate is higher in workers, the reason sometimes (but not always) is due to workplace exposures.
What the Cadmium Mortality Study Found
Overall Death Rate
Overall, cadmium workers had lower death rates than the general public. For example, heart disease death rates were lower.
Lung Cancer
NIOSH found that cadmium workers who had worked for at least 2 years definitely had a higher death rate for lung cancer. This was probably due to breathing in cadmium.
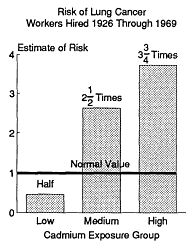
As the first chart below shows, the more cadmium a worker was exposed to, the more likely he developed lung cancer.
Smoking causes lung cancer. But, overall, the cadmium workers don’t smoke more than the general public. NIOSH has smoking information on only 14 of the 24 men who died of lung cancer. 13 of the 14 were cigarette smokers.
Workers employed at the plant before 1926 (when the plant was an arsenic smelter) had a very high risk of lung cancer-more than 7 times greater than normal. This was probably due to high arsenic levels.
For workers hired since 1926, NIOSH thinks that both smoking and cadmium probably contributed to the lung cancer. Arsenic may have contributed to a lesser extent
Other Diseases
NIOSH had much weaker evidence that cadmium exposure was associated with cancer of the prostate gland and digestive disease (mainly stomach ulcers).
We are not sure that these 2 problems are related to cadmium, though.
Cadmium Exposure Levels
The areas with the highest cadmium levels in the past were: calcine, roaster, sampling, mixing, solution, retort, foundry, pigment, and tankhouse. These departments are listed roughly in descending order of exposure.
The level in retort may still be high, but in general levels are much lower today than in the past.
An Estimate of Risk-Lung Cancer and Cadmium Exposure
NIOSH estimated how much cadmium each worker had been exposed to at the plant by the end of 1976. We assigned each worker to the low, medium, or high cadmium exposure group.
Charts for the Cadmium Mortality Study
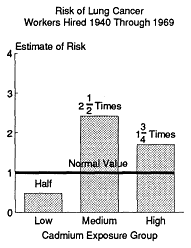
The charts show the risk of dying from lung cancer for cadmium workers at the plant. They give the risks for the 3 exposure groups.
The first chart shows the risk for all workers hired from 1926 through 1969. The second chart shows the risk for workers hired between 1940 and 1969.
Each bar shows the estimate of risk of dying from lung cancer. They are estimates of how the group of workers compares to normal. Normal is the general population of Colorado.
The “normal” value is 1.0. The lines across the charts show the normal value. When the bar is below 1.0, cadmium workers have less risk. When the bar is above 1.0, they have more risk.
Chart 3 – Workers Hired 1926-1969

Here is how to interpret the risk estimates in chart 3:
- Workers in the low group had about half the risk of other Coloradoans.
- Workers in the medium group were about 2 and a half times more likely to die of lung cancer.
Workers in the high exposure group were almost 4 times more likely to die of lung cancer.
The chart shows that the risk went up as exposure to cadmium increased. This is important evidence that cadmium exposure is associated with lung cancer.
Chart 4 – Workers Hired 1940-1969

The risks in the second chart are interpreted the same way. For example, workers in the high exposure group had about 1¾ times the risk of other Coloradoans.
Workers in the medium exposure group also had an elevated risk of lung cancer. Workers in the low group didn’t have a higher risk.
Other Facts
All deaths from lung cancer took place in employees who had worked for at least 2 years.
We can compare the risks shown in charts 1 and 2 to the risk of cigarette smoking. Smokers are about 9 times more likely to die of lung cancer than non-smokers. 10% of the 234 workers who died by 1984 had died of lung cancer. In the general U.S. population, about 8% of white men die of lung cancer.
Steps to Protect Your Health
There is no way to undo the cadmium exposure that you have experienced. However, you can take steps to protect your health and lower your personal risk of disease. Some questions you may have and their answers follow.
How Will I Know If I Have Any of These Diseases?
Below we list symptoms of the conditions studied in the NIOSH studies.
Even if you have any of these symptoms, that does not mean you have a serious illness. Many less serious conditions could have these symptoms.
However, you should have your health checked by your doctor to be sure. This is especially true if the symptoms don’t go away.
Symptoms of lung cancer include shortness of breath, chest pain, coughing a lot, bringing up a lot of mucus, weight low, and coughing up blood.
Kidney damage has no early warning symptoms. If you are still exposed to cadmium, you should have:
- a urine test for cadmium several times a year
- blood and urine tests at least once a year to check for early signs of possible kidney damage
your blood pressure checked every year. If you no longer are exposed to cadmium, you should have urine tests for kidney function done once.
The main symptom of prostate cancer is difficulty in urinating. All men over age 40 should have their prostate checked by a doctor every year, even if they don’t have symptoms.
Symptoms of digestive diseases (especially stomach ulcers) include stomach pain, nausea, vomiting, and black stools (bowel movements).
If your employer gives you medical tests, you have a legal right to examine and copy the results and give them to your personal physician under OSHA regulation 29 CFR 1910.20.
What Can I Do to Avoid Getting These Diseases?
These diseases appear to be related to working in a cadmium plant. Therefore, reducing workplace exposures to cadmium and other hazardous chemicals is very important.
If you are still working in a job with cadmium exposure, talk to your employer and your union representative about how best to reduce your exposure.
The NIOSH study showed that lung cancer was probably associated with cadmium exposure.
Workers who smoke (like smokers in the general population) would greatly lower their risk of lung cancer by quitting. Call the American Cancer Society (listed on the other side of this sheet) for help in quitting.
What Are My Chances of Dying of Lung Cancer?
No one can give you an exact answer to this question. Your risk is higher if you were exposed to a lot of cadmium, if you smoke, and if you are over age 50.
Of the 625 men in the study, 376 men are still alive. 24 men died of lung cancer.
The fact sheet, “Estimated Relative Risk of Dying from Lung Cancer”, gives a better idea based on your exposure to cadmium. Your doctor can help you estimate your chances, too.
Estimated “Relative” Risk of Dying from Lung Cancer
The relative risk gives results in the form of how many times greater (or less) than normal is the risk of the study group. The table below shows the relative risks using Colorado state rates as normal (these are translated into the “expected” number of deaths). The investigators also did these analyses using U.S. rates.
The relative risk equals the number of observed deaths divided by the number of expected deaths. For example, whereas 11.74 deaths were “expected” in all workers, 24 were observed. 24/11.74=2.04. All the elevated relative risks listed in the table are statistically significant.
The relative risks are interpreted in this way: 1.00 is “normal. ” A relative risk less than 1.00 means the workers’ risk is less than that of the general population; more than 1.00 means their risk is greater. For example a risk of 0.46 means the workers’ risk is slightly less than half that of normal. A risk of 3.73 means their risk is 3.73 times greater than normal. Note that the group’s risk increased as cadmium exposure increased. No lung cancer deaths occurred in workers employed for less than two years.
| Category | Total Number of Workers Studied 1 |
Number of Workers Who Had Died of Lung Cancer By 1984 | Number of Workers Who Were “Expected” to Die of Lung Cancer by 1984 Using Colorado State Rates | Relative Risk Using Colorado State Rates |
| All Workers |
603
|
24
|
11.74
|
2.04
|
| Low Cadmium Exposure |
292
|
2
|
4.37
|
0.46
|
| Medium Cadmium Exposure |
216
|
13
|
4.95
|
2.63
|
| High Cadmium Exposure |
95
|
9
|
2.42
|
3.73
|
1 Workers hired after 1925 and employed for at least 6 months between 1940 – 1969; “follow-up” through 1984.
General Information on Lung Cancer in Smokers
Cigarette smoking is the most common cause of lung cancer.
Male smokers in general (not exposed to cadmium) are 22 times more likely to die of lung cancer than nonsmokers. (We don’t know if these risks are different for smokers also exposed to cadmium).
For smokers in general (not exposed to cadmium), the risk of dying from lung cancer goes down if they quit smoking:
The risk for smokers who smoke less than a pack a day goes to almost normal between 5-9 years after quitting.
The risk for smokers who smoke more than a pack a day decreases to about double that of the nonsmoker more than 10 years after quitting.
The absolute risk provides information about the death rate from lung cancer in the general population and in the cadmium study cohort
General Population
About 8% of all white males who died in the U.S. in 1985 died of lung cancer.
The actual death rate per year for lung cancer in all white males aged 60 to 64 living in Colorado in 1980-1984 was about 2 out of 1000. At less than 60 years of age, the rate was less than 1 out of 1000. At greater than age 64, the rate was more than 2 out of 1000.
Cadmium Study Cohort
Of the cadmium workers who died by 1984, 10% died of lung cancer.
NIOSH estimates that about 10% of the workers employed for two or more years in jobs exposed to cadmium would die of lung cancer. This estimate is based on the excess risk attributable to cadmium exposure, taking the mortality rate in the general public into account.
As of 1984, about 376 of the original 625 study members were still living. If 10% of them die of lung cancer, this will come to about 37 or 38 people. This is probably a high estimate of the future number of deaths.
Because workers were exposed to cadmium, their risk of getting lung cancer is higher than the general public’s. For example, the risk of dying from lung cancer for all workers at the plant studied considered together is 2.04 times higher than the general population of Colorado. If the rate in the general population is 1 out of 1000 men, the additional risk with cadmium exposure makes the lung cancer death rate in plant workers equal to (2.04 x 1)/1000 = 2.04 out of 1000.
This shows that even though the risk is higher for cadmium workers, the actual number of workers who die of lung cancer because of cadmium exposure may be low.
For more information please call the NIOSH toll-free number at 800-356-4674.
Additional Resources
Thun M, Schnorr T, Smith A, et al. (1985). Mortality among a cohort of U.S. cadmium workers: An update. Journal of the National Cancer Institute 74(2): 325-333. (Study Report)
- Page last reviewed: April 11, 2017
- Page last updated: July 13, 2012
- Content source:
- National Institute for Occupational Safety and Health (NIOSH) Division of Surveillance, Hazard Evaluations, and Field Studies.


 ShareCompartir