

Percentage of Adults Aged 65 and Over With Osteoporosis or Low Bone Mass at the Femur Neck or Lumbar Spine: United States, 2005–2010
 ShareCompartir
On This Page
by Anne C. Looker, Ph.D.; and Steven M. Frenk, Ph.D., Division of Health and Nutrition Examination Surveys
Osteoporosis is an important risk factor for fragility fracture in older adults (1). According to the World Health Organization, osteoporosis is defined as a bone mineral density (BMD) value that is more than 2.5 standard deviation (SD) units below the mean BMD value for a young non-Hispanic white female reference group (1). Low bone mass, a milder reduction in BMD, is defined as a BMD value between 1.0 and 2.5 SD units below the mean value for a young non-Hispanic white female reference group (1). Recent estimates of the prevalence of osteoporosis and low bone mass at the femur neck or lumbar spine in U.S. adults focused on adults aged 50 and over (2). However, there is also interest in the prevalence of osteoporosis among adults aged 65 and over because most adults in this group are eligible for Medicare coverage (3).
This Health E-Stat provides information on the percentage of U.S. adults aged 65 and over with osteoporosis and low bone mass at the femur neck or lumbar spine, using data from the 2005–2010 National Health and Nutrition Examination Survey (NHANES).
During 2005–2010, 16.2% of adults aged 65 and over had osteoporosis at the lumbar spine or femur neck (Table 1, Figure 1). The age-adjusted prevalence of osteoporosis at either skeletal site was higher among women (24.8%) than men (5.6%). The unadjusted prevalence was higher among adults aged 80 and over (25.7%) than for adults aged 65–79 (12.8%). The age-adjusted prevalence of osteoporosis was highest among Mexican-American adults (24.9%), followed by non-Hispanic white adults (15.7%), and was lowest among non-Hispanic black adults (10.3%).
Also during 2005–2010, 48.3% of adults aged 65 and over had low bone mass at the lumbar spine or femur neck (Table 2, Figure 2). Women had a higher age-adjusted prevalence of low bone mass at either skeletal site (52.3%) than men (44.0%). Adults aged 80 and over had a higher unadjusted prevalence of low bone mass (52.7%) than adults aged 65–79 (46.7%). Non-Hispanic black adults had the lowest age-adjusted prevalence of low bone mass (36.7%), while non-Hispanic white and Mexican-American adults had similar age-adjusted prevalences of low bone mass (49.4% and 47.3%, respectively).
NHANES is conducted by the Centers for Disease Control and Prevention’s (CDC) National Center for Health Statistics (NCHS) to assess the health and nutritional status of the civilian noninstitutionalized population of the United States. Each survey participant completes a household interview and a physical examination conducted in a mobile examination center. In 2005–2010, BMD at the femur neck and lumbar spine was measured using dual-energy x-ray absorptiometry (DXA).
Observations for persons missing a femur neck or lumbar spine measurement were not included in the data analysis. Data for the young female reference group were defined as recommended by the International Society for Clinical Densitometry (4). For additional information on NHANES methods, visit: https://www.cdc.gov/nchs/nhanes/survey_methods.htm.
References
- Kanis JA, McCloskey EV, Johansson H, Oden A, Melton LJ 3rd, Khaltaev N. A reference standard for the description of osteoporosis. Bone 42(3):467–75. 2008.
- Wright NC, Looker AC, Saag KG, Curtis JR, Delzell ES, Randall S, Dawson-Hughes B. The recent prevalence of osteoporosis and low bone mass in the United States based on bone mineral density at the femoral neck or lumbar spine. J Bone Miner Res 29(11):2520–6. 2014.
- Moon M. What Medicare has meant to older Americans. Health Care Financ Rev 18(2):49–59. 1996.
- Schousboe JT, Shepherd JA, Bilezikian JP, Baim S. Executive summary of the 2013 International Society for Clinical Densitometry Position Development Conference on bone densitometry. J Clin Densitom 16(4):455–66. 2013.
Tables
* Estimate not shown has a relative standard error greater than 40% and does not meet standards of reliability or precision.
** Estimate has a relative standard error greater than 30% and less than or equal to 40% and should be used with caution because it does not meet standards of reliability or precision.
1Significantly different from men (p < 0.05).
2Significantly different from age group 65–79 (p < 0.05).
3Significantly different from non-Hispanic white (p < 0.05).
4Significantly different from non-Hispanic black (p < 0.05).
NOTES: World Health Organization diagnostic criteria were used to define osteoporosis as a bone mineral density (BMD) value at the femur neck or lumbar spine that falls more than 2.5 standard deviation units below the mean BMD for young non-Hispanic white females. Age-adjusted by the direct method to 2000 or 2010 Census Bureau estimates using the age groups 65–79 and 80 and over. Estimates adjusted to the 2010 Census are included to be comparable with methodology used in Wright N et al., J Bone Miner Res 2014;29(11):2520-6.
SOURCE: CDC/NCHS, National Health and Nutrition Examination Survey, 2005-2010.
1Significantly different from men (p < 0.05).
2Significantly different from age group 65–79 (p < 0.05).
3Significantly different from non-Hispanic white (p < 0.05).
4Significantly different from non-Hispanic black (p < 0.05).
NOTES: World Health Organization diagnostic criteria were used to define low bone mass as a bone mineral density (BMD) value at the femur neck or lumbar spine that falls between 1.0 and 2.5 standard deviation units below the mean BMD for young non-Hispanic white females. Age-adjusted by the direct method to the 2000 or 2010 Census Bureau estimates using the age groups 65–79 and 80 and over. Estimates adjusted to the 2010 Census are included to be comparable with the methodology used in Wright N et al., J Bone Miner Res 2014;29(11):2520–6.
SOURCE: CDC/NCHS, National Health and Nutrition Examination Survey, 2005–2010.
Figures
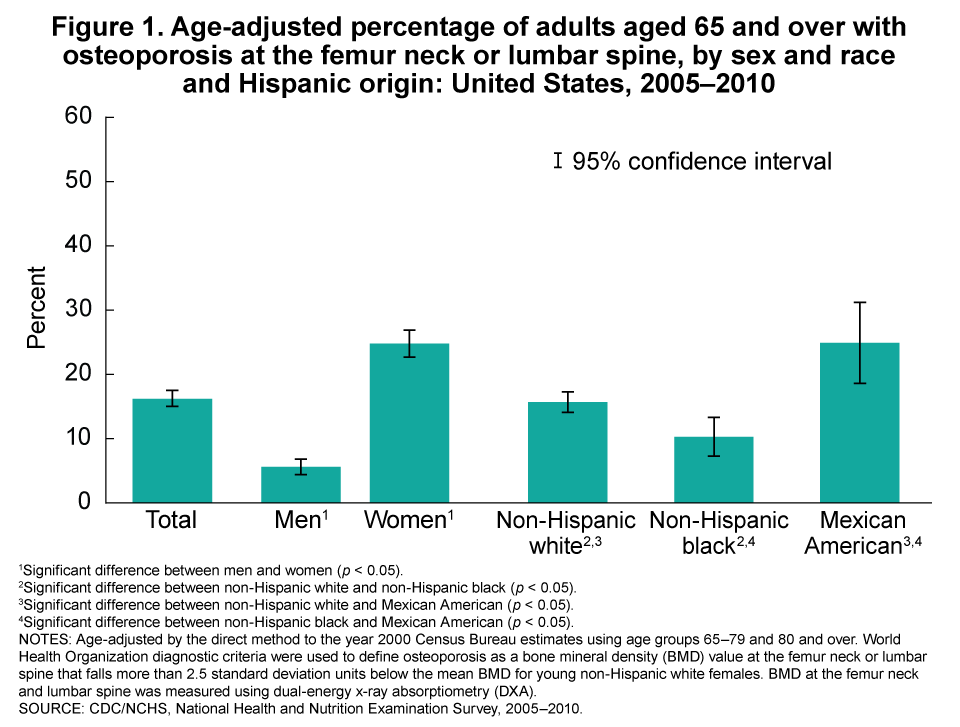
1Significant difference between men and women (p < 0.05).
2Significant difference between non-Hispanic white and non-Hispanic black (p < 0.05).
3Significant difference between non-Hispanic white and Mexican American (p < 0.05).
4Significant difference between non-Hispanic black and Mexican American (p < 0.05).
NOTES: Age-adjusted by the direct method to the year 2000 Census Bureau estimates using age groups 65–79 and 80 and over. World Health Organization diagnostic criteria were used to define osteoporosis as a bone mineral density (BMD) value at the femur neck or lumbar spine that falls more than 2.5 standard deviation units below the mean BMD for young non-Hispanic white females. BMD at the femur neck and lumbar spine was measured using dual-energy x-ray absorptiometry (DXA).
SOURCE: CDC/NCHS, National Health and Nutrition Examination Survey, 2005–2010.
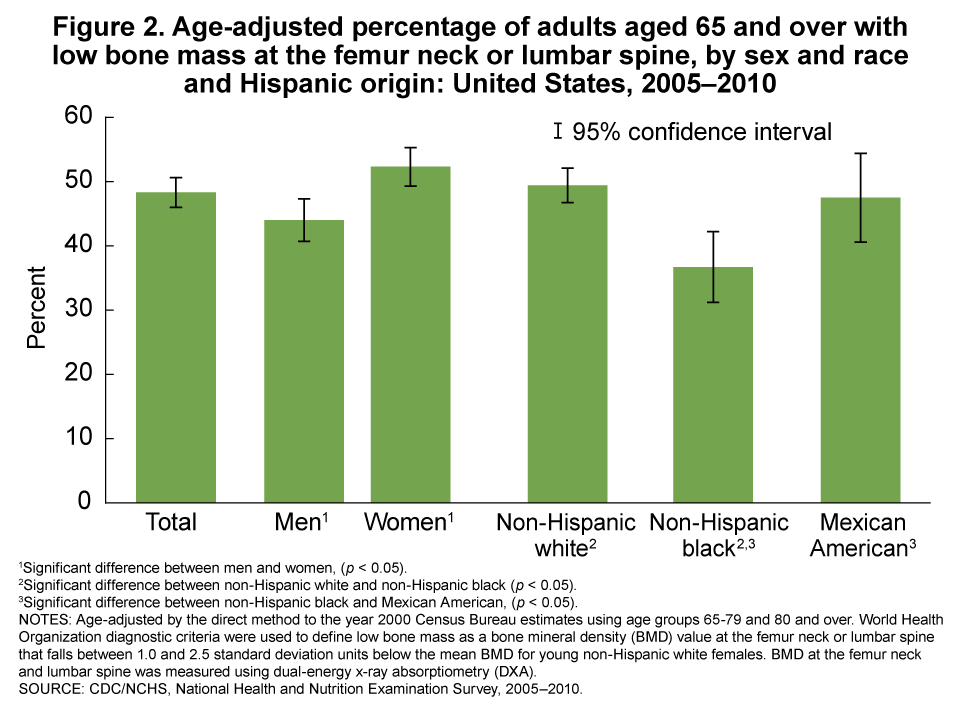
1Significant difference between men and women (p < 0.05).
2Significant difference between non-Hispanic white and non-Hispanic black (p < 0.05).
3Significant difference between non-Hispanic black and Mexican American (p < 0.05).
NOTES: Age-adjusted by the direct method to the year 2000 Census Bureau estimates using age groups 65–79 and 80 and over. World Health Organization diagnostic criteria were used to define low bone mass as a bone mineral density (BMD) value at the femur neck or lumbar spine that falls between 1.0 and 2.5 standard deviation units below the mean BMD for young non-Hispanic white females. BMD at the femur neck and lumbar spine was measured using dual-energy x-ray absorptiometry (DXA).
SOURCE: CDC/NCHS, National Health and Nutrition Examination Survey, 2005–2010.
- Page last reviewed: November 6, 2015
- Page last updated: August 13, 2015
- Content source: