Mortality from Major Cardiovascular Diseases: United States, 2007
by Arialdi M. Miniño, M.P.H., Division of Vital Statistics; and Richard J. Klein, M.P.H., Office of Analysis and Epidemiology
PDF Version (85 KB)
Mortality from major cardiovascular diseases (International Classification of Diseases, Tenth Revision (ICD-10) I00-I78) includes deaths from Diseases of heart (ICD-10 codes I00-I09, I11, I13, I20-I51); Essential hypertension and hypertensive renal disease (I10, I12, I15) and Cerebrovascular diseases (I60-169) (1). The National Center for Health Statistics (NCHS) routinely monitors trends in these causes of death (2). The Healthy People (HP) 2010 program tracks progress toward a wide range of health-related objectives (3). To track mortality from Coronary heart disease, the HP 2010 program includes deaths classified to ICD-10 codes I11, I20-I25. These codes were selected to be as comparable as possible with the previous HP 2000 coronary heart disease objective that was monitored using ICD-9 codes 402, 410-414, 429.2 (4). This objective is proposed to be continued using the same ICD-10 codes for HP 2020 (5). Coronary heart disease is a subcategory of Diseases of heart and is not listed separately in reports produced by the Division of Vital Statistics, NCHS.
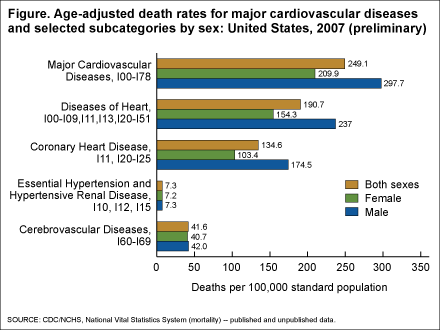
For all categories of major cardiovascular disease deaths shown, males had a higher age-adjusted death rate than females (see Figure ). The death rate for males dying from Major cardiovascular diseases (the larger category containing all other subcategories) is 42 percent higher than the rate for females (297.7 compared with 209.9 deaths per 100,000 standard population). The death rate from Diseases of heart is 54 percent higher for males than for females (237.0 compared with 154.3 deaths per 100,000 standard population). The death rate for Coronary heart disease (a subcategory of Diseases of heart defined by HP 2020 using ICD-10 codes I11, I20-I25) is 69 percent higher for males than for females (174.5 compared with 103.4 deaths per 100,000 standard population). Differences in the rates of death for males compared with females are smaller for Essential hypertension and hypertensive renal disease, and for Cerebrovascular diseases.
Nature and sources of data
Preliminary mortality data for 2007 (6) are based on a substantial proportion of death records for that year. Medical or cause-of-death information was available for an estimated 83 percent of infant deaths and 87 percent of deaths of persons aged 1 year and over in 2007. The data for 2007 are based on the continuous receipt and processing of statistical records through October 2008, by NCHS. NCHS received the data from the states’ vital registration systems through the Vital Statistics Cooperative Program. In this report, U.S. totals include only events occurring within the 50 states and the District of Columbia.
References
- World Health Organization. International Statistical Classification of Diseases and Related Health Problems, Tenth Revision, Second Edition. Geneva: World Health Organization. 2004.
- National Center for Health Statistics. ICD-10 Cause-of-death lists for tabulating mortality statistics, updated March, 2009. NCHS instruction manual, part 9. Hyattsville, MD: Public Health Service. 2007.
- U.S. Department of Health and Human Services. Healthy People 2010. Washington, DC: U.S. Government Printing Office. 2nd ed. 2000.
- U.S. Department of Health and Human Services. Healthy People 2000: National Health Promotion and Disease Prevention Objectives. Washington, DC: HHS, Public Health Service. 1991.
- Healthy People 2020 Proposed Draft Objectives. Online access: December 2009.
- Xu J, Kochanek KD, Tejada-Vera B. Deaths: Preliminary data for 2007. National vital statistics reports; vol 58 no 1. Hyattsville, MD: National Center for Health Statistics. 2009.
Suggested citation
Miniño AM, Klein RJ. Health mortality from major cardiovascular diseases: United States, 2007. Health E-Stats. National Center for Health Statistics. March 2010.
Figure

- Page last reviewed: November 6, 2015
- Page last updated: March 4, 2010
- Content source:


 ShareCompartir