

National Vital Statistics System
 ShareCompartir
NCHS Fact Sheet, March 2017
PDF Version (363 KB)
About NCHS
The National Center for Health Statistics (NCHS) is the nation’s principal health statistics agency, providing data to identify and address health issues. NCHS compiles statistical information to help guide public health and health policy decisions.
Collaborating with other public and private health partners, NCHS uses a variety of data collection mechanisms to obtain accurate information from multiple sources. This process provides a broad perspective on the population’s health, influences on health, and health outcomes.
National Vital Statistics System
The National Vital Statistics System (NVSS) provides the nation’s official vital statistics data, and is the oldest, most successful example of intergovernmental data sharing in public health. Through NVSS, the 57 vital registration jurisdictions (50 states, New York City, District of Columbia, and five U.S. territories) send NCHS information on the 6.5 million birth, death, and fetal death events occurring each year. NCHS collects, analyzes, and disseminates these data to create the nation’s official vital statistics. NVSS provides the most complete and continuous data available to public health officials at the national, state, and local levels, and in the private sector. NVSS vital statistics are a critical component of the national health information system, providing data to monitor progress toward achieving important health goals.
Selected key health indicators produced by NVSS include:
- Teen births and birth rates
- Prenatal care and preterm birth
- Risk factors for adverse pregnancy outcomes
- Infant mortality rates
- Life expectancy
- Leading causes of death
Examples of NVSS Data
Life expectancy
Life expectancy at birth represents the average number of years that a group of infants would live if the group was to experience, throughout life, the age-specific death rates present in the year of birth.
- In 2015, life expectancy at birth was 78.8 years for the total U.S. population—a decrease of 0.1 year from 78.9 years in 2014. For males, life expectancy changed from 76.5 years in 2014 to 76.3 years in 2015—a decrease of 0.2 years. For females, life expectancy decreased 0.1 year from 81.3 years in 2014 to 81.2 years in 2015. Life expectancy for females was consistently higher than it was for males.
- In 2015, life expectancy at age 65 for the total population was 19.4 years, the same as in 2014. Life expectancy at age 65 was 20.6 years for females and 18.0 years for males, both unchanged from 2014.
Life expectancy at selected ages, by sex: United States, 2014 and 2015
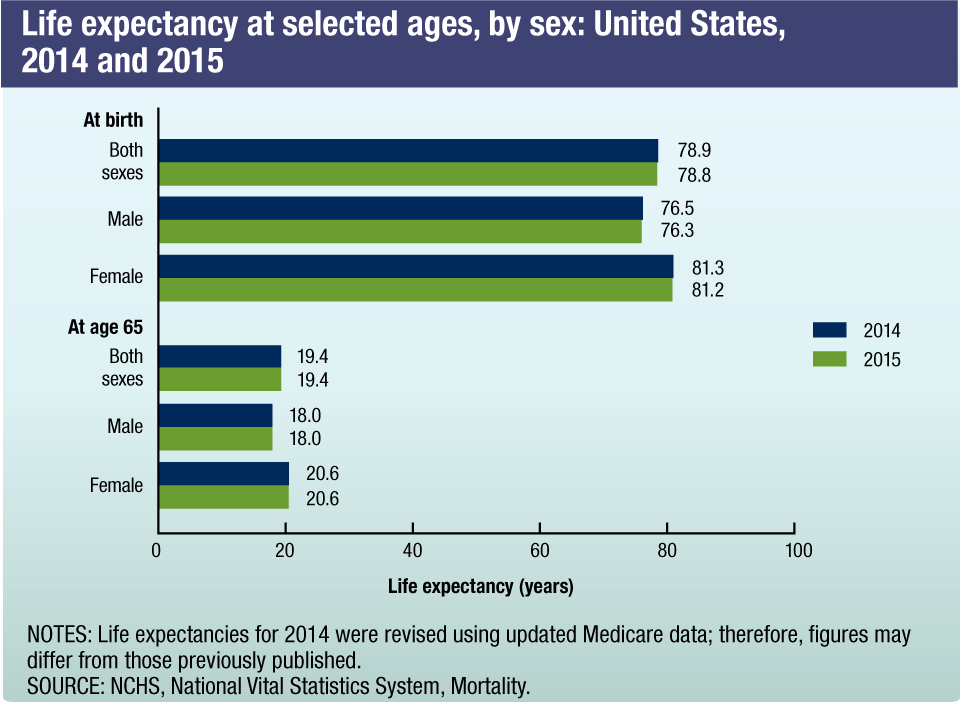
NOTES: Life expectancies for 2014 were revised using updated Medicare data; therefore, figures may differ from those previously published.
SOURCE: NCHS, National Vital Statistics System, Mortality.
Percent change in birth rates for females aged 15–19: United States, each state, 2007–2015
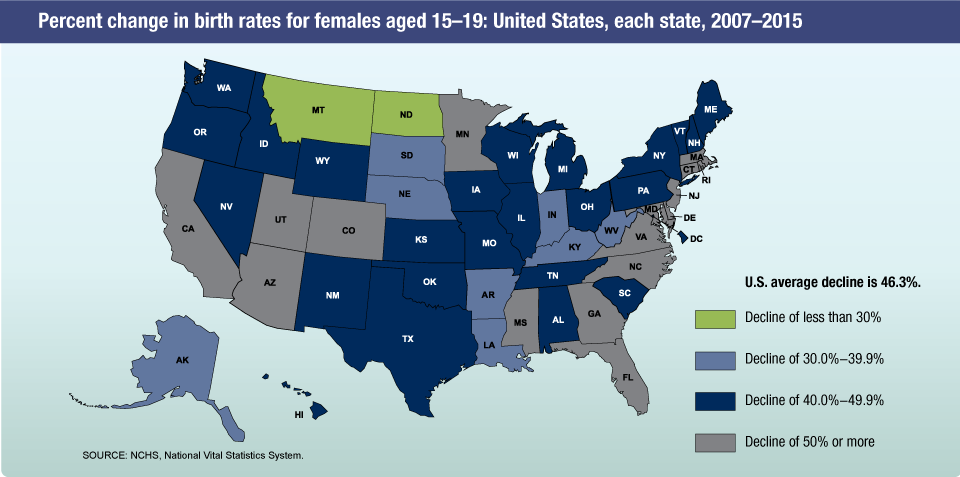
SOURCE: NCHS, National Vital Statistics System.
Teenage births
The teenage birth rate is an important indicator of population change and helps describe patterns of early family formation. Among women of childbearing age, teenagers are least likely to receive timely prenatal care, are more likely to smoke, and are more likely to have a low birthweight infant, all of which lead to poorer health outcomes for the children of teen mothers. Data are now available on the trends in teen birth rates in urban (metropolitan) and rural (nonmetropolitan) areas in the United States.
- The birth rate for teenagers declined to another historic low for the United States in 2015, down 8% from 2014 to 22.3 births per 1,000 females aged 15–19.
- In 2015, birth rates for teenagers aged 15–19 declined to 6.9 for Asian or Pacific Islander, 16.0 for non-Hispanic white, 25.7 for American Indian or Alaska Native, 31.8 for non-Hispanic black, and 34.9 for Hispanic females.
- Birth rates for teenagers aged 15–19 declined in both urban and rural counties from 2007 to 2015, with the largest declines occurring in large urban counties and the smallest declines occurring in rural counties.
Additional findings from NVSS
Birth data
- The cesarean delivery rate declined for the third year in a row to 32.0% of U.S. births in 2015, down from 32.2% in 2014 and the lowest rate since 2007. The rate peaked in 2009 at 32.9% after increasing every year since 1996 (20.7%).
- The preterm birth rate rose slightly in 2015 to 9.63%, from 9.57% in 2014. The preterm birth rate had declined 8% from 2007 (10.44%), the most recent year for which comparable data are available, to 2015.
Infant mortality
- The infant mortality rate changed from 582.1 infant deaths per 100,000 live births in 2014 to 589.5 in 2015, but this change was not statistically significant.
- The 10 leading causes of infant death in 2015 included congenital malformations, low birthweight, sudden infant death syndrome, maternal complications, unintentional injuries, cord and placental complications, bacterial sepsis of newborn, respiratory distress of newborn, diseases of the circulatory system, and neonatal hemorrhage.
Leading causes of death
- In 2015, the 10 leading causes of death—heart disease, cancer, chronic lower respiratory diseases, unintentional injuries, stroke, Alzheimer disease, diabetes, influenza and pneumonia, kidney disease, and suicide—remained the same as in 2014. The 10 leading causes accounted for 74.2% of all deaths in the United States in 2015.
Challenges and Future Opportunities
NCHS continues to work with NVSS partners to modernize the technology infrastructure of the U.S. vital statistics system by moving all states from outdated paper-based systems to web-based systems integrated with electronic health records and public health information systems, and by re-engineering the NCHS automated coding system. These technologies will allow for rapid compilation and use of these critical data sources, and will enable the vital statistics system to more effectively contribute to (1) the public health surveillance of disease outbreaks at the community, state, and national levels; (2) health services research; and (3) public health policy decisions at all levels of government.
For further information about NCHS, visit https://www.cdc.gov/nchs.
For further information about NVSS, visit https://www.cdc.gov/nchs/nvss.htm.
- Page last reviewed: March 21, 2017
- Page last updated: March 21, 2017
- Content source: