

Health, United States 2015
 ShareCompartir
NCHS Fact Sheet, August 2016
PDF Version (259 KB)
About NCHS
The National Center for Health Statistics (NCHS) is the nation’s principal health statistics agency, providing data to identify and address health issues. NCHS compiles statistical information to help guide public health and health policy decisions.
Collaborating with other public and private health partners, NCHS employs a variety of data collection mechanisms to obtain accurate information from multiple sources. This process provides a broad perspective to help understand the population’s health, influences on health, and health outcomes.
Health, United States 2015
Health, United States, 2015 is the 39th annual report on the health status of the nation, produced by NCHS and submitted by the Secretary of the Department of Health and Human Services to the President and Congress. The report includes data from a variety of federal government and private-sector sources, organized around four major subject areas: health status and determinants, health care utilization, health care resources, and health care expenditures.
Each year, Health, United States includes a special feature. To coincide with the 30th anniversary of the 1985 Report of the Secretary’s Task Force on Black and Minority Health, the 2015 report includes a special feature on racial and ethnic health disparities. The 1985 report was released by then Secretary of Health and Human Services, Margaret Heckler, and is known as the Heckler Report. The Heckler Report documented significant disparities in the burden of disease and mortality experienced by black persons and other minorities compared to white persons and laid out an ambitious national agenda to improve minority health.
Selected Findings From the “Special Feature on Racial and Ethnic Health Disparities”
Infant mortality
- Throughout 1999–2013, infant mortality rates were highest among infants born to non-Hispanic black women (11.11 infant deaths per 1,000 live births) and lowest among infants born to non-Hispanic Asian or Pacific Islander women (3.90 infant deaths per 1,000 live births).
- The difference between the highest (non-Hispanic black) and lowest (non-Hispanic Asian or Pacific Islander) infant mortality rates narrowed from 1999 (9.41 infant deaths per 1,000 live births) to 2013 (7.21 infant deaths per 1,000 live births).
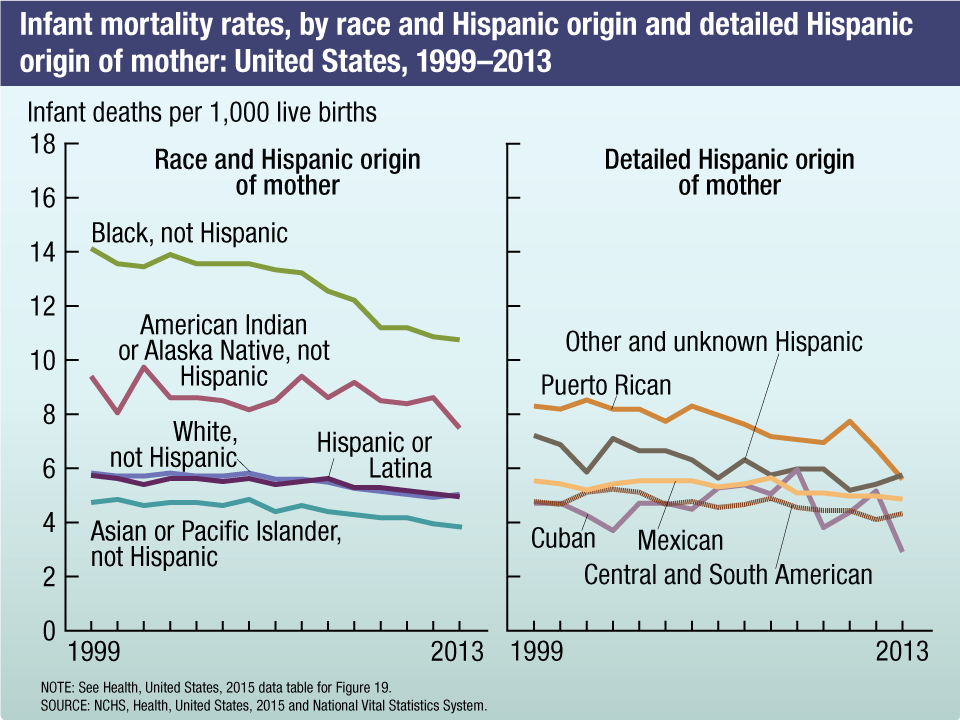
NOTE: See Health, United States, 2015 data table for Figure 19.
SOURCE: NCHS, Health, United States, 2015 and National Vital Statistics System.
Hypertension
- The difference between the group with the highest (non-Hispanic black) and lowest (Mexican origin) age-adjusted percentage of adults 20 and over with hypertension was stable between 1999–2000 and 2013–2014.
- In 2013–2014, the difference between these two groups (42.7% age-adjusted for non-Hispanic black and 28.8% age-adjusted for Mexican origin adults) was 13.9 percentage points.
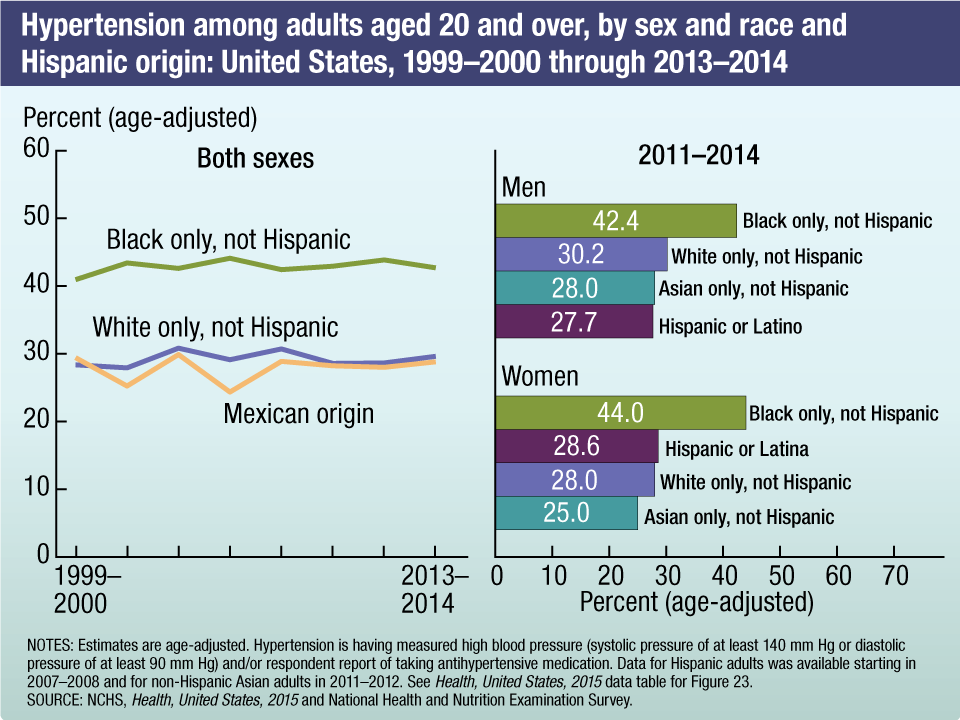
NOTES: Estimates are age-adjusted. Hypertension is having measured high blood pressure (systolic pressure of at least 140 mm Hg or diastolic pressure of at least 90 mm Hg) and/or respondent report of taking antihypertensive medication. Data for Hispanic adults was available starting in 2007–2008 and for non-Hispanic Asian adults in 2011–2012. See Health, United States, 2015 data table for Figure 23.
SOURCE: NCHS, Health, United States, 2015 and National Health and Nutrition Examination Survey.
Health insurance coverage
- During 1999–June 2015, Hispanic adults aged 18–64 were more likely to be uninsured (27.2% in the first 6 months of 2015), and non-Hispanic white adults aged 18–64 were the least likely to be uninsured, except in the first 6 months of 2015, when non-Hispanic Asian adults had the lowest percentage uninsured (7.3% in the first 6 months of 2015).
- The difference between the group with the highest and lowest percentage of uninsured adults narrowed from a 24.9 percentage point difference in 1999 (between Hispanic and non-Hispanic white adults) to a 19.9 percentage point difference in June 2015 (between Hispanic and non-Hispanic Asian adults).
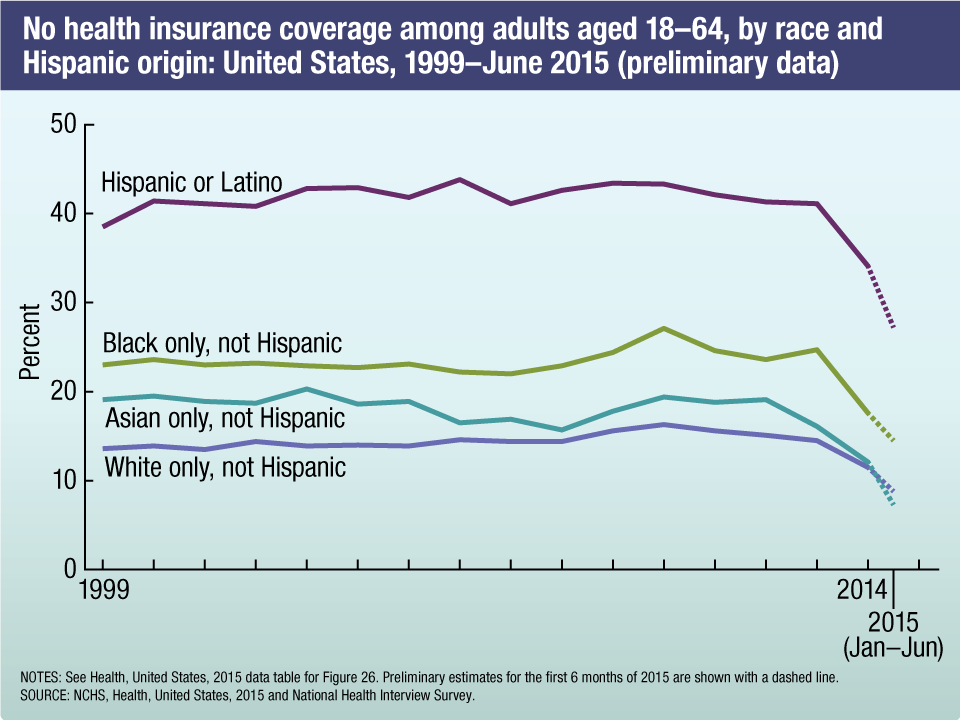
NOTES: See Health, United States, 2015 data table for Figure 26. Preliminary estimates for the first 6 months of 2015 are shown with a dashed line.
SOURCE: NCHS, Health, United States, 2015 and National Health Interview Survey.
For further information about NCHS and its programs, visit https://www.cdc.gov/nchs.
For further information about Health, United States, visit https://www.cdc.gov/nchs/hus.htm.
- Page last reviewed: October 5, 2016
- Page last updated: October 5, 2016
- Content source: