

NCHS Fact Sheet
 ShareCompartir
October 2014
NCHS Data on Drug Poisoning Deaths
PDF Version (308 KB)
About NCHS
The National Center for Health Statistics (NCHS) is the Nation’s principal health statistics agency, providing data to identify and address health issues. NCHS compiles statistical information to help guide public health and health policy decisions.
Collaborating with other public and private health partners, NCHS employs a variety of data collection mechanisms to obtain accurate information from multiple sources. This process provides a broad perspective to help us understand the population’s health, influences on health, and health outcomes.
NCHS Drug Poisoning Data
Poisoning is the leading cause of injury death in the United States. Drugs—both legal and illegal—cause the vast majority of poisoning deaths.
NCHS uses the National Vital Statistics System (NVSS) to monitor deaths due to drug poisoning. NVSS collects and compiles mortality information from death certificates in all 50 states and the District of Columbia.
NCHS identifies the number of drug poisoning deaths from the underlying cause of death on death certificates. Multiple causes of death are used to identify the drugs involved.
Opioid analgesic pain relievers are involved in a substantial proportion of drug poisoning deaths. Opioid analgesics include:
- natural and semisynthetic opioid analgesics such as hydrocodone, morphine, and oxycodone.
- methadone
- other synthetic opioid analgesics such as fentanyl and meperidine
Approximately 25 percent of drug poisoning deaths lack information on the specific drugs involved; some of these deaths may involve opioid analgesics.
Recent Trends
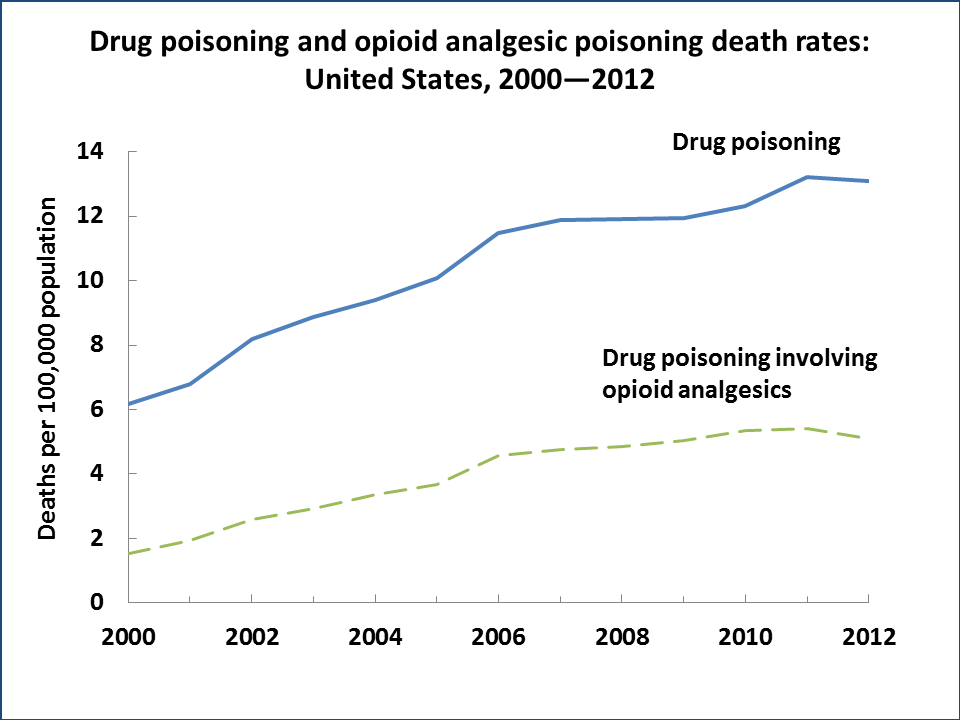
- Since 2000, the age-adjusted drug poisoning death rate more than doubled, from 6.2 per 100,000 in 2000 to 13.1 per 100,000 in 2012.
- In 2012, 41,502 deaths were due to drug poisoning; 80 percent of these deaths were unintentional, 13 percent were suicides, and 7 percent were of undetermined intent.
- In 2011, opioid analgesics were involved in 41 percent of drug poisoning deaths (16,917 deaths); in 2012, that decreased to 39 percent (16,007 deaths).
- The age-adjusted rate for deaths involving opioid analgesics more than tripled from 1.5 per 100,000 in 2000 to 5.4 per 100,000 in 2011, then declined to 5.1 per 100,000 in 2012.
Source: National Vital Statistics System, 2000–2012.
Who is Most at Risk?
From 2000 to 2012, the drug poisoning death rate per 100,000 population increased for males and females, all racial and ethnic groups, and all age groups.
Sex
- From 2000 to 2012, drug poisoning death rates increased nearly 150 percent for females and more than 90 percent for males.
- In 2012, the age-adjusted rate of drug poisoning deaths for males (16.1) was 1.6 times that of females (10.2).
Race and ethnicity
- From 2000 to 2012, drug poisoning death rates increased more than 150 percent for the non-Hispanic white population, compared with an increase of less than 20 percent for the non-Hispanic black population.
- Age-adjusted death rates in 2012 were 16.8 among non-Hispanic whites and 8.7 among non-Hispanic blacks.
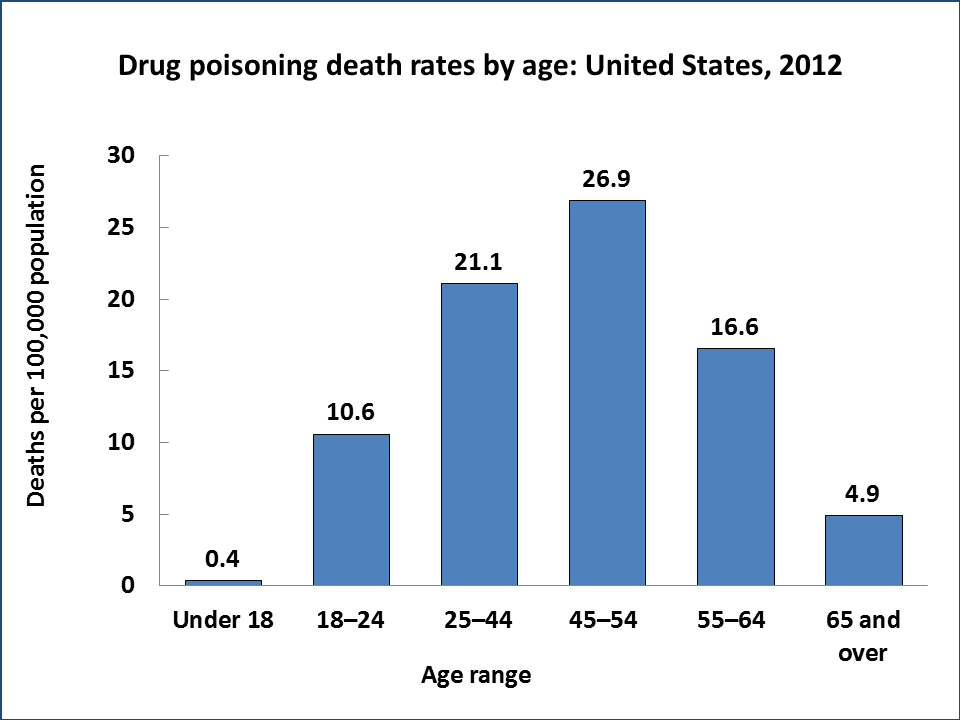
Age groups
- Since 2004, the drug poisoning death rate has been highest among those aged 45–54.
- From 2011 to 2012, death rates increased significantly among those aged 55–64 and 65 and over, increasing 4 and 7 percent, respectively.
Source: National Vital Statistics System, 2012.
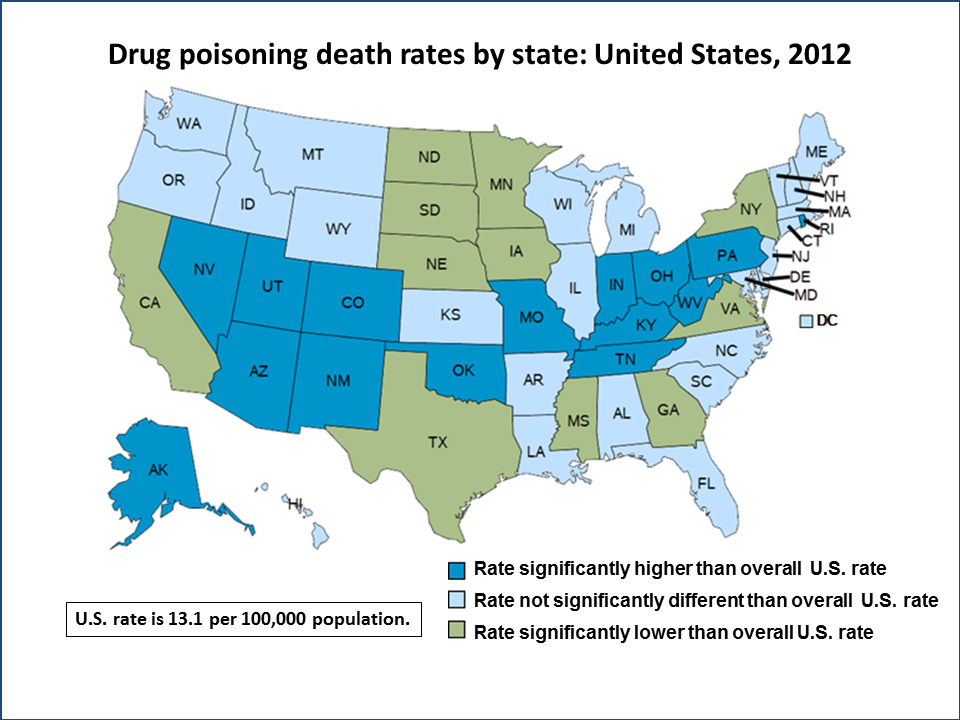
Drug Poisoning Death Rates by State
Deaths per 100,000 population varied by state. The five states with the highest drug poisoning death rates were West Virginia (32.0), Kentucky (25.0), New Mexico (24.7), Utah (23.1), and Nevada (21.0).
NOTE: Drug poisoning death rates are age-adjusted deaths per 100,000 standard population.
Source: National Vital Statistics System, 2012.
For further information about NCHS and its programs, visit http://www.cdc.gov/nchs.
- Page last reviewed: November 6, 2015
- Page last updated: December 2, 2014
- Content source: