

NCHS Data on Drug-poisoning Deaths
 ShareCompartir
NCHS Fact Sheet, August 2017
PDF Version (296 KB)
About NCHS
The National Center for Health Statistics (NCHS) is the nation’s principal health statistics agency, providing data to identify and address health issues. NCHS compiles statistical information to help guide public health and health policy decisions.
Collaborating with other public and private health partners, NCHS uses a variety of data collection mechanisms to obtain accurate information from multiple sources. This process provides a broad perspective on the population’s health, influences on health, and health outcomes.
NCHS Drug-poisoning Data
Poisoning is the leading cause of injury death in the United States. Drugs—both pharmaceutical and illicit—cause the vast majority of poisoning deaths.
NCHS uses the National Vital Statistics System (NVSS) to monitor deaths due to drug poisoning (overdose). NVSS collects mortality information from death certificates in all 50 states and the District of Columbia. NCHS identifies the number of drug-poisoning deaths from the underlying cause of death on death certificates. Multiple causes of death are used to identify the drugs involved. In 2015, approximately 17% of death certificates for drug-poisoning deaths lacked information on the specific drugs involved.
Recent Findings
- Since 1999, the age-adjusted drug-poisoning death rate has more than tripled, from 6.1 per 100,000 in 1999 to 16.3 per 100,000 in 2015.
- In 2015, 52,404 deaths involved drug poisoning: 84% of these deaths were unintentional, 10% were suicides, and 6% were of undetermined intent.
- From 2010 to 2015, the percentage of drug overdose deaths involving:
- heroin tripled from 8% in 2010 to 25% in 2015.
- natural and semisynthetic opioid analgesics, which include drugs such as oxycodone and hydrocodone, decreased from 29% in 2010 to 24% in 2015.
- methadone decreased from 12% in 2010 to 6% in 2015.
- synthetic opioids other than methadone, which include drugs such as fentanyl (pharmaceutical and illicit) and tramadol, increased from 8% in 2010 to 18% in 2015.
- cocaine increased from 11% in 2010 to 13% in 2015.
- psychostimulants with abuse potential, which include drugs such as methamphetamine and ritalin, increased from 5% in 2010 to 11% in 2015.
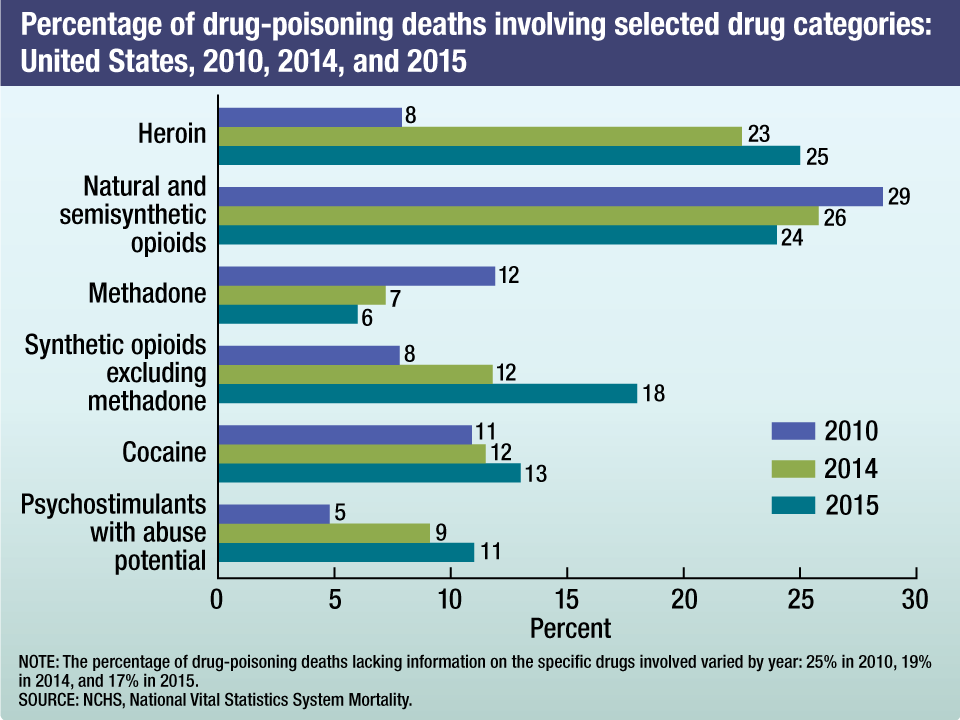
NOTE: The percentage of drug-poisoning deaths lacking information on the specific drugs involved varied by year: 25% in 2010, 19% in 2014, and 17% in 2015.
SOURCE: NCHS, National Vital Statistics System, Mortality.
Who is most at risk?
From 1999 through 2015, the drug-poisoning death rate per 100,000 population increased for many demographic groups.
Sex
- From 1999 to 2015, drug-poisoning death rates increased 3-fold for females and 2.5-fold for males.
- In 2015, the age-adjusted rate for drug-poisoning deaths for males (20.8 per 100,000) was 1.8 times that of females (11.8).
Race and ethnicity
- From 1999 to 2015, drug-poisoning death rates tripled for non-Hispanic white persons and increased 1.6-fold for non-Hispanic black persons and 1.4-fold for Hispanic persons.
- In 2015, the age-adjusted drug-poisoning death rate was 21.1 for non-Hispanic white persons, 12.2 for non-Hispanic black persons, and 7.7 for Hispanic persons.
Age
In 2015, the drug-poisoning death rate was highest for adults aged 45–54.
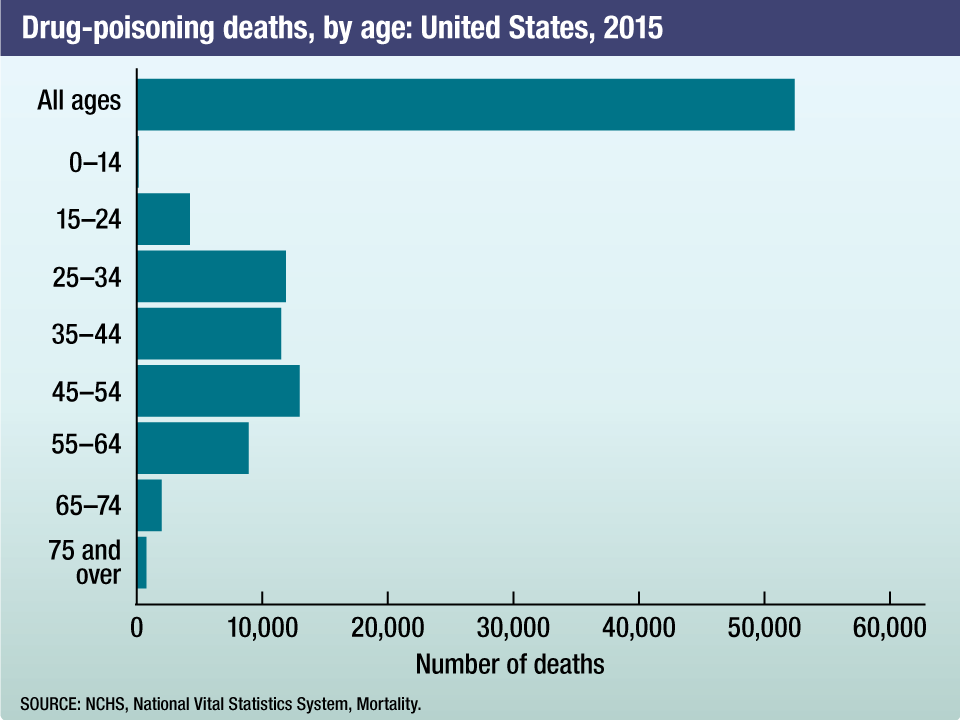
SOURCE: NCHS, National Vital Statistics System, Mortality.
Drug-poisoning death rates, by state
Deaths per 100,000 population varied by state. The four states with the highest age-adjusted drug-poisoning death rates in 2015 were:
- West Virginia (41.5)
- New Hampshire (34.3)
- Kentucky (29.9)
- Ohio (29.9)
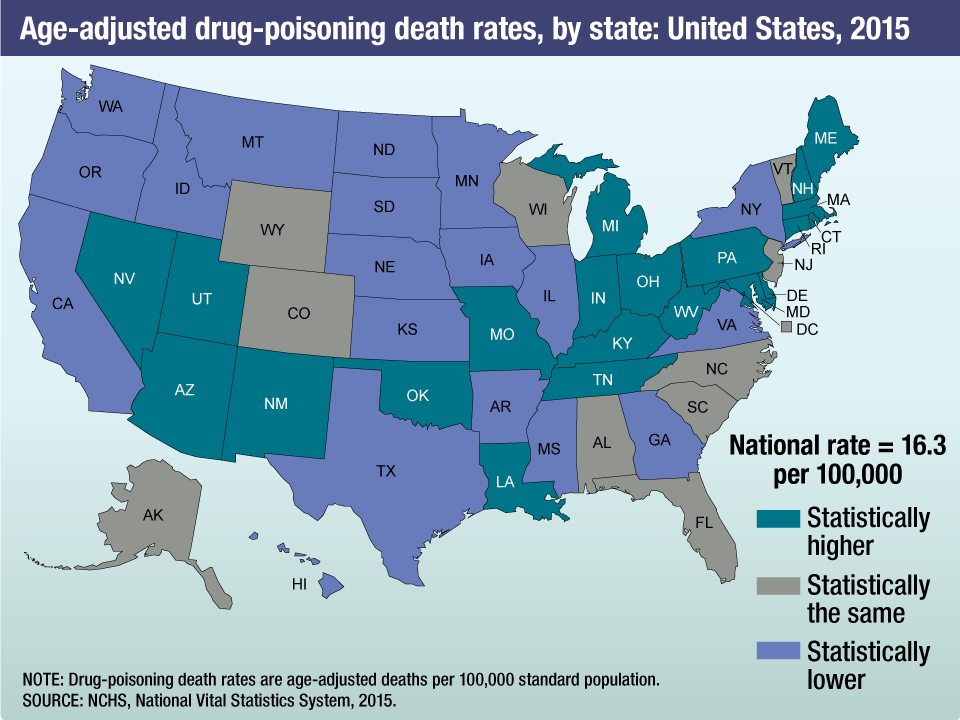
NOTE: Drug-poisoning death rates are age-adjusted deaths per 100,000 standard population.
SOURCE: NCHS, National Vital Statistics System, 2015.
Challenges and Future Opportunities
- Improve reporting of the specific drug(s) involved in drug-poisoning deaths on the death certificate.
- Enhance capacities to search the cause-of-death description on the death certificate for drug mentions.
- Work with Medical Examiners and Coroners to improve timeliness of reporting drug-poisoning deaths.
- Improve automated cause-of-death coding systems for faster reporting.
- Explore opportunities to link electronic death records to electronic health records.
- Develop capacity to support monthly reporting of drug-poisoning deaths.
For more information about NCHS, visit https://www.cdc.gov/nchs.
For more information about NVSS, visit https://www.cdc.gov/nchs/nvss.htm.
- Page last reviewed: April 5, 2016
- Page last updated: April 5, 2016
- Content source: