

Adult Obesity Prevalence in Canada and the United States
 ShareCompartir
NCHS Data Brief No. 56, March 2011
On this Page
- Key findings
- Are there differences in obesity prevalence estimates between Canada and the United States?
- Are there differences in obesity prevalence estimates between the non-Hispanic white populations in Canada and the United States?
- Have changes in obesity prevalence in the last 20 years been similar in Canada and the United States?
- Summary
- Definitions
- Data sources
- About the authors
- References
- Suggested citation
PDF Version (583 KB)
Margot Shields; Margaret D. Carroll, M.S.P.H.; and Cynthia L. Ogden, Ph.D.
Key findings
Data from the Canadian Health Measures Survey, 2007–2009; the Canadian Heart Health Surveys, 1986–1992; and the U.S. National Health and Nutrition Examination Survey, 1988–1994 and 2007–2008
- The prevalence of obesity among adults in Canada is lower than it is in the United States.
- Among the non-Hispanic white population, the prevalence of obesity is lower in Canada than in the United States, but the difference is not as large as it is when comparing the entire populations.
- Between the late 1980s and 2007–2009, the prevalence of obesity increased in both Canada and the United States.
- In 2007–2009, the prevalence of obesity among young and middle-aged Canadian women was similar to that observed in U.S. women 20 years earlier.
Obesity is a public health challenge throughout the world (1). Ongoing monitoring of trends in obesity is important to assess interventions aimed at preventing or reducing the burden of obesity. Since the 1960s, measured height and weight have been collected in the United States as part of the National Health and Nutrition Examination Survey (NHANES). In Canada, data on measured height and weight have been collected from nationally representative samples of the population less regularly. This changed in 2007 with the launch of the Canadian Health Measures Survey (CHMS), the scope and purpose of which are similar to those of NHANES. The objective of this report is to compare estimates of the prevalence of obesity between Canadian and American adults.
Keywords: National Health and Nutrition Examination Survey, Canadian Health Measures Survey, body mass index, international comparison
Are there differences in obesity prevalence estimates between Canada and the United States?
In 2007–2009, the prevalence of obesity in Canada was 24.1%, over 10 percentage points lower than in the United States (34.4%). Among men, the prevalence of obesity was over 8 percentage points lower in Canada than in the United States (24.3% compared with 32.6%) and among women, more than 12 percentage points lower (23.9% compared with 36.2%) (Figure 1).
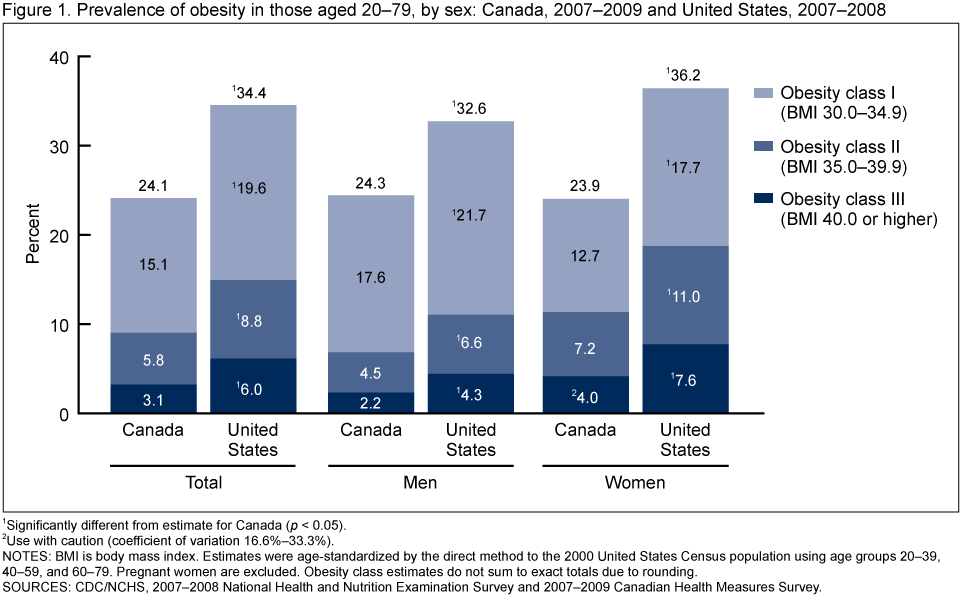
Because the risk of adverse health effects increases at higher levels of body mass index (BMI), obesity is divided into three categories (1,2). In all three categories, prevalence was significantly lower in Canada than in the United States. In the highest BMI category the prevalence was twice as high in the United States (6.0%) compared with Canada (3.1%).
Are there differences in obesity prevalence estimates between the non-Hispanic white populations in Canada and the United States?
When comparisons were restricted to the non-Hispanic white population in each country, differences in obesity estimates were somewhat attenuated but the overall prevalence of obesity remained significantly lower in Canada than in the United States among both men and women (Figure 2).
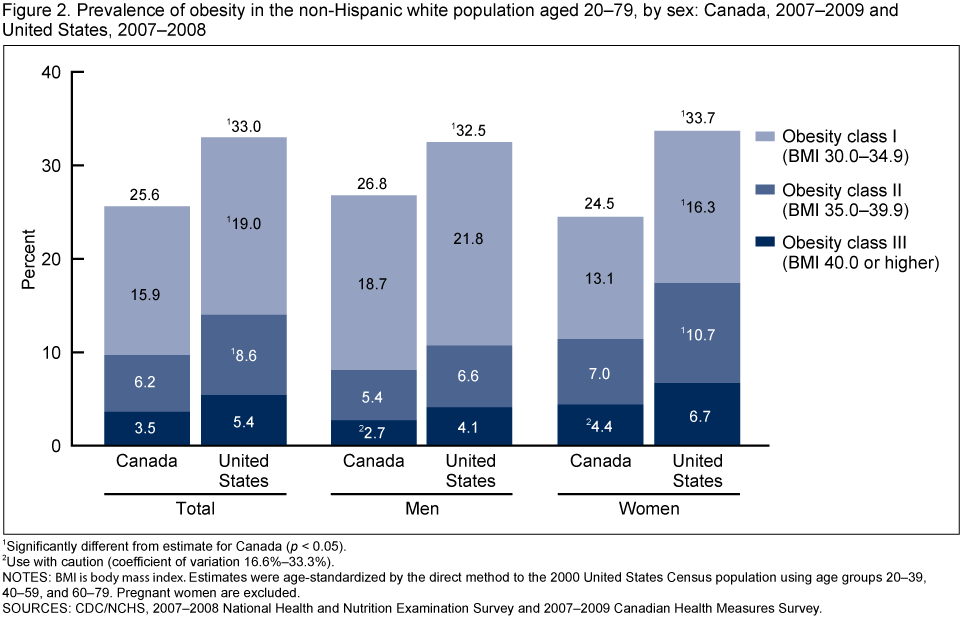
In Canada, almost 26% of the non-Hispanic white population was obese compared with 33.0% of the non-Hispanic white population in the United States. Among the heaviest (class III obesity), however, the prevalence was more similar in the two countries (3.5% in Canada and about 5% in the United States).
The racial makeup of the population in the two countries explains why the difference in prevalence is larger when the general populations are compared than when the non-Hispanic white populations are compared. In the United States, the majority of the nonwhite population is black or Hispanic for whom the prevalence of obesity is higher than it is for the white population (3). Among nonwhite Canadians, the largest group is comprised of East/Southeast Asian persons for whom the prevalence of obesity is lower than it is for the white population (4).
Have changes in obesity prevalence in the last 20 years been similar in Canada and the United States?
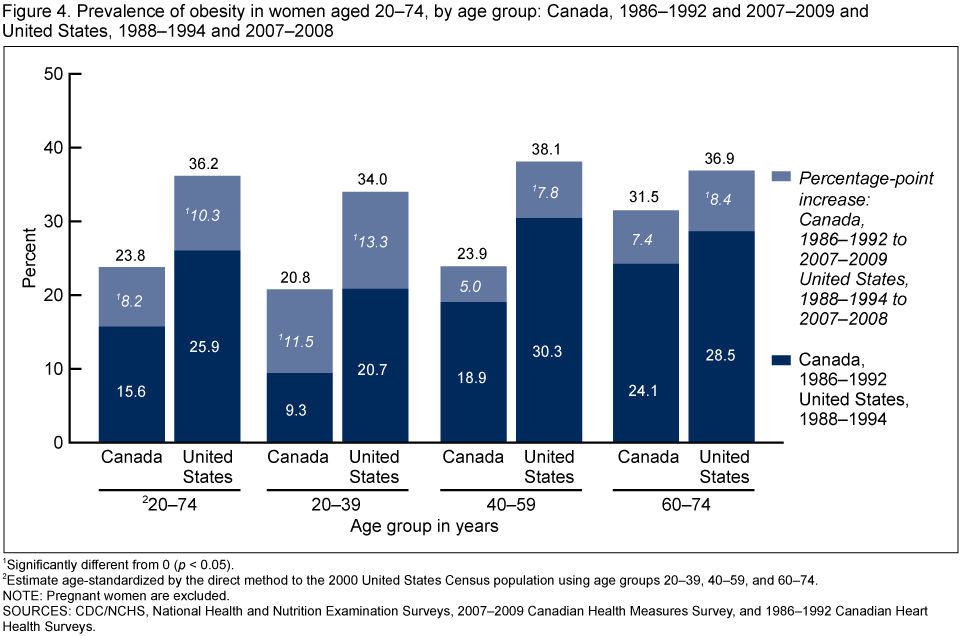
Current obesity prevalence estimates were compared with estimates from the 1988–1994 NHANES and the 1986–1992 Canadian Heart Health Surveys (CHHS). In both countries the prevalence of obesity rose significantly since these earlier surveys, and the magnitude of the increases were fairly similar in the two countries. In Canadian men the prevalence rose by approximately 10 percentage points, and among men in the United States the prevalence rose by 12 percentage points (Figure 3). Among women, the increase was approximately 8 percentage points in Canada and approximately 10 percentage points in the United States (Figure 4).
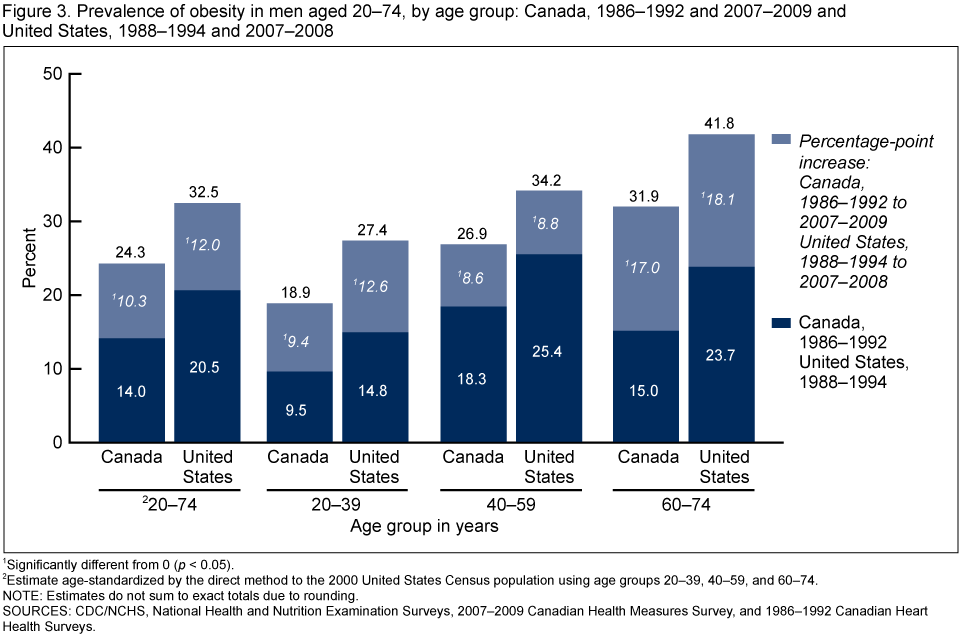
Over the 20-year period, patterns of increase were fairly consistent across age groups, in both the United States and Canada. Among men, the increase was highest among those aged 60–74: 17 percentage points in Canada and approximately 18 percentage points in the United States. Among women, the increases were highest among those aged 20–39. In Canada the prevalence increased over 11 percentage points and in the United States over 13 percentage points.
At both time points, significant differences in prevalence estimates between the two countries were pronounced for young (those aged 20–39) and middle-aged (those aged 40–59) women. In these age groups, the prevalence of obesity in Canadian women in 2007–2009 was similar to or lower than that observed in U.S. women 20 years earlier (Figure 4). Among older women, obesity prevalence estimates were similar between the two countries and differences were not statistically significant at either time period.
Summary
The prevalence of obesity is significantly higher among U.S. adults than among their Canadian counterparts. U.S. estimates were higher for all three obesity classes for both men and women. When the population was limited to non-Hispanic white persons, the overall prevalence of obesity for both U.S. men and women remained statistically higher than those for Canadian men and women, but the magnitude of the difference was reduced and there was no significant difference in the prevalence of class III obesity.
Between the late 1980s and today, the prevalence of obesity increased significantly in both the United States and Canada. Increases followed a similar pattern in the two countries, particularly among men. Among women, increases have also occurred in both countries, however, in both the late 1980s and today the estimates of obesity prevalence for young and middle-aged U.S. women have been substantially higher than for their Canadian counterparts. In the United States the increases in the prevalence of obesity observed in the 1980s and 1990s did not appear to continue at the same rate during the current decade, particularly among women and possibly for men (3). Insufficient data points for measured height and weight preclude the possibility of conducting a similar study on the Canadian population. However, the availability of future cycles of NHANES and CHMS data will permit further exploration and comparison of obesity trends in the two countries.
Definitions
Body mass index (BMI): Calculated as weight in kilograms (kg) divided by height in meters squared (m2), rounded to one decimal place. For male and female adults aged 20 and over, obesity class I was defined as a BMI of 30.0–34.9 kg/m2; obesity class II was defined as a BMI of 35.0–39.9 kg/m2; and obesity class III was defined as a BMI of 40.0 kg/m2 or higher. See the Table below for examples of obesity at different heights.
Table. Obesity cut points for adults 5’4” and 5’9”
| Height | Obesity class I | Obesity class II | Obesity class III |
|---|---|---|---|
| 5’4” | 174 pounds | 204 pounds | 232 pounds |
| 5’4” | 79 kilograms | 93 kilograms | 105 kilograms |
| 5’9” | 203 pounds | 236 pounds | 270 pounds |
| 5’9” | 92 kilograms | 107 kilograms | 123 kilograms |
Data sources
U.S. estimates were based on data from two surveys that are part of NHANES (5)—the third NHANES (NHANES III) and NHANES 2007–2008. NHANES is designed to monitor the health and nutritional status of the U.S. civilian noninstitutionalized population. The survey consists of interviews conducted in participants' homes, standardized physical examinations conducted in mobile examination centers, and laboratory tests utilizing blood and urine specimens provided by participants during the physical examination.
NHANES III, the third in a series of periodic NHANES surveys, was conducted during 1988–1994. Beginning in 1999, NHANES became a continuous survey, fielded on an ongoing basis. Public-use data files are released in 2-year cycles. Each 2-year cycle of data collection is based on a representative sample covering all ages of the civilian noninstitutionalized population.
NHANES III and NHANES 2007–2008 samples were selected through a complex multistage design that includes selection of primary sampling units (counties), segments (groups of households) within the counties, households within segments, and finally, sample persons within households. The sample design includes oversampling in order to obtain reliable estimates of health and nutritional measures for population subgroups. In 2007–2008, African-American persons, all Hispanic persons, persons with low income, and persons aged 60 and over were oversampled. In NHANES III, children aged 2 months–5 years, older persons aged 60 and over, non-Hispanic black persons, and Mexican-American persons were oversampled. In 2007–2008, measured height and weight were collected from 5,181 NHANES respondents aged 20–79 and 4,876 aged 20–74. During NHANES III, measured height and weight were collected from 14,319 adults aged 20–74.
Canadian estimates are based on data from cycle 1 of CHMS collected between March 2007 and February 2009 (6). CHMS covered the population aged 6–79 living in private households. Residents of Indian Reserves or Crown lands, institutions and certain remote regions, and full-time members of the regular Canadian Forces were excluded. Approximately 96.3% of Canadians were represented. In addition to a household interview, CHMS involved a visit to a mobile examination center where respondents underwent anthropometric measurements, participated in fitness tests, and blood and urine specimens were taken.
Sample selection for CHMS was based on the Canadian Labour Force Survey area frame, which was used to create 257 sites across the country grouped into four strata (7). A total of 15 sites were selected at random from the four strata using a systematic sampling method with probability proportional to the size of each site's population. Further stratification was carried out within each sampled site and a random sample of dwellings was selected from each stratum. Finally, one or two persons were selected at random within each sampled dwelling. In the 2007–2009 CHMS, measured height and weight were collected from 3,486 respondents aged 20–79.
Historical estimates in Canada are from CHHS, conducted between 1986 and 1992. Respondents were sampled through a stratified multistage probability sampling design (8). The medical insurance registers of the 10 provinces were used as the sampling frame from which age-sex strata were formed and a sample of persons was selected at random from each stratum. Measured height and weight were obtained for 19,208 respondents aged 20–74. Comparisons of the prevalence of obesity over time were based on the population aged 20–74 because CHHS did not include those aged 75 and over.
For all surveys, sample weights—which account for the differential probabilities of selection, nonresponse, and noncoverage—are incorporated into the estimation process. The total estimates were age-adjusted by the direct method to the 2000 United States Census population using three age groups: 20–39, 40–59, and 60–79 (or 20–39, 40–59, and 60–74 for analyses across time). Estimates age standardized to the Canadian population were almost identical to estimates standardized to the U.S. population. To compare the prevalence of obesity between the United States and Canada, statistical hypotheses were tested using a Student's t statistic with 11 degrees of freedom and an α level of 0.05. All data analyses were performed using the statistical packages SAS version 9.21 (SAS Institute, Cary, N.C.) and SUDAAN version 10 (Research Triangle Institute, Research Triangle Park, N.C.).
About the authors
Margot Shields is with Statistics Canada, Health Analysis Division. Margaret D. Carroll and Cynthia L. Ogden are with the Centers for Disease Control and Prevention's National Center for Health Statistics, Division of Health and Nutrition Examination Surveys.
References
- World Health Organization. Obesity: Preventing and managing the global epidemic. Report of a WHO consultation. World Health Organ Tech Rep Ser 894:i–xii, 1–253. Geneva: World Health Organization. 2000.
- Health Canada. Canadian guidelines for body weight classification in adults. Catalogue H49–179/2003E. Ottawa: Health Canada. 2003.
- Flegal KM, Carroll MD, Ogden CL, Curtin LR. Prevalence and trends in obesity among US adults, 1999–2008. JAMA 303(3):235–41. 2010.
- Tremblay MS, Pérez CE, Ardern CI, Bryan SN, Katzmarzyk PT. Obesity, overweight and ethnicity. Statistics Canada, Catalogue 82–003. Health Rep 16(4):23–34. 2005.
- National Center for Health Statistics. Questionnaires, datasets, and related documentation. [Accessed 7/18/10].
- Tremblay M, Wolfson M, Connor Gorber S. Canadian Health Measures Survey: Rationale, background and overview. Statistics Canada, Catalogue 82–003. Health Rep 18 Suppl:7–20. 2007.
- Giroux S. Canadian Health Measures Survey: Sampling strategy overview. Statistics Canada, Catalogue 82–003. Health Rep 18 Suppl:31–6. 2007.
- MacLean DR, Petrasovits A, Nargundkar M, Connelly PW, MacLeod E, Edwards A, Hessel P. Canadian Heart Health Surveys: A profile of cardiovascular risk. Survey methods and data analysis. Canadian Heart Health Surveys Research Group. CMAJ 146(11):1969–74. 1992.
Suggested citation
Shields M, Carroll MD, Ogden CL. Adult obesity prevalence in Canada and the United States. NCHS data brief, no 56. Hyattsville, MD: National Center for Health Statistics. 2011.
Copyright information
All material appearing in this report is in the public domain and may be reproduced or copied without permission; citation as to source, however, is appreciated.
National Center for Health Statistics
Edward J. Sondik, Ph.D., Director
Jennifer H. Madans, Ph.D., Associate Director for Science
Division of Health and Nutrition Examination Surveys
Clifford L. Johnson, M.S.P.H., Director
- Page last reviewed: November 6, 2015
- Page last updated: March 2, 2011
- Content source: