

Increase in Fatal Poisonings Involving Opioid Analgesics in the United States, 1999-2006
 ShareCompartir
NCHS Data Brief No. 22, September 2009
On this Page
- Key findings
- The number of poisoning deaths and the percentage of these deaths involving opioid analgesics increased each year from 1999 through 2006.
- From 1999 through 2006, poisoning deaths involving methadone rose more rapidly than those involving other opioid analgesics, cocaine, or heroin.
- Throughout the period 1999-2006, people aged 35-54 years had higher poisoning death rates involving opioid analgesics than those in other age groups.
- More than one type of drug was mentioned in the majority of poisoning deaths that involved opioid analgesics in 2006.
- Death rates for poisoning involving opioid analgesics varied more than eightfold among the states in 2006.
- Summary
- Definitions
- Data sources and methods
- About the authors
- References
- Suggested citation
PDF Version (1.2 MB)
Margaret Warner, Ph.D.; Li Hui Chen, M.S., Ph.D.; and Diane M. Makuc, Dr.P.H.
Key findings
Data from the National Vital Statistics System Mortality File
- From 1999 through 2006, the number of fatal poisonings involving opioid analgesics more than tripled from 4,000 to 13,800 deaths.
- Opioid analgesics were involved in almost 40% of all poisoning deaths in 2006.
- In 2006, the rate of poisoning deaths involving opioid analgesics was higher for males, persons aged 35-54 years, and non-Hispanic white persons than for females and those in other age and racial/ethnic groups.
- In about one-half of the deaths involving opioid analgesics, more than one type of drug was specified as contributing to the death, with benzodiazepines specified with opioid analgesics most frequently.
- The age-adjusted death rate for poisoning involving opioid analgesics varied more than eightfold among the states in 2006.
Poisoning is the second leading cause of injury death overall, and the leading cause of injury death for people aged 35-54 years, surpassing both firearm-related and motor vehicle-related deaths in this age group (1,2). During the Healthy People 2010 midcourse review, reduction of poisoning mortality was one of the injury objectives identified as moving away from its target. One of the challenges discussed during the review is a lack of recognition of the extent of the problem.
Drug poisonings are the largest portion of the poisoning burden and opioid analgesic-related deaths (see “Definitions ” section) are among the fastest increasing drug poisoning deaths (3,4). This report highlights trends in fatal opioid analgesic-related poisonings from the years 1999-2006.
Keywords: National Vital Statistics System Mortality File, methadone, drugs, overdose
The number of poisoning deaths and the percentage of these deaths involving opioid analgesics increased each year from 1999 through 2006.
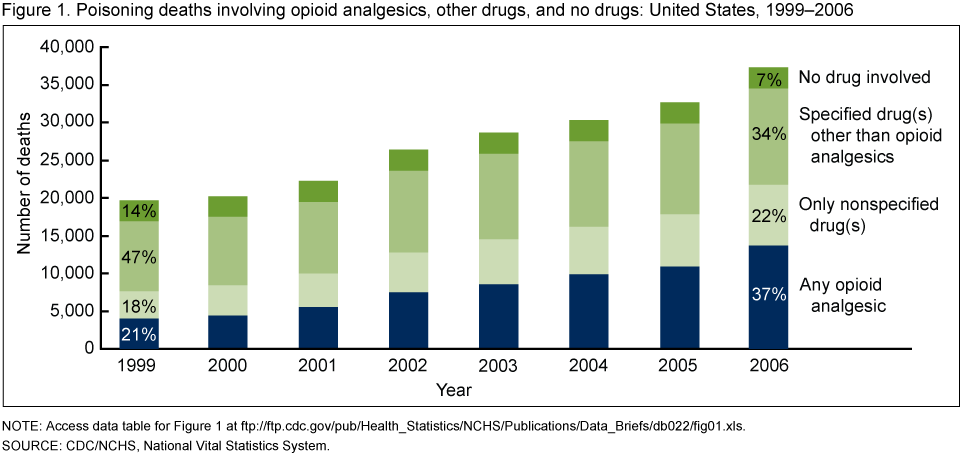
NOTE: Access data table for Figure 1 [XLS - 21 KB]
SOURCE: CDC/NCHS, National Vital Statistics System.
From 1999 through 2006, the number of poisoning deaths nearly doubled from almost 20,000 to more than 37,000 (Figure 1). In 2006, over 90% of poisoning deaths involved drugs.
Opioid analgesics were involved in almost 40% of all poisoning deaths in 2006, up from about 20% in 1999. The death records for about one-fifth of poisoning deaths each year indicated drug involvement, but did not specify the substance involved; an unknown proportion of these deaths involved opioid analgesics.
From 1999 through 2006, poisoning deaths involving methadone rose more rapidly than those involving other opioid analgesics, cocaine, or heroin.
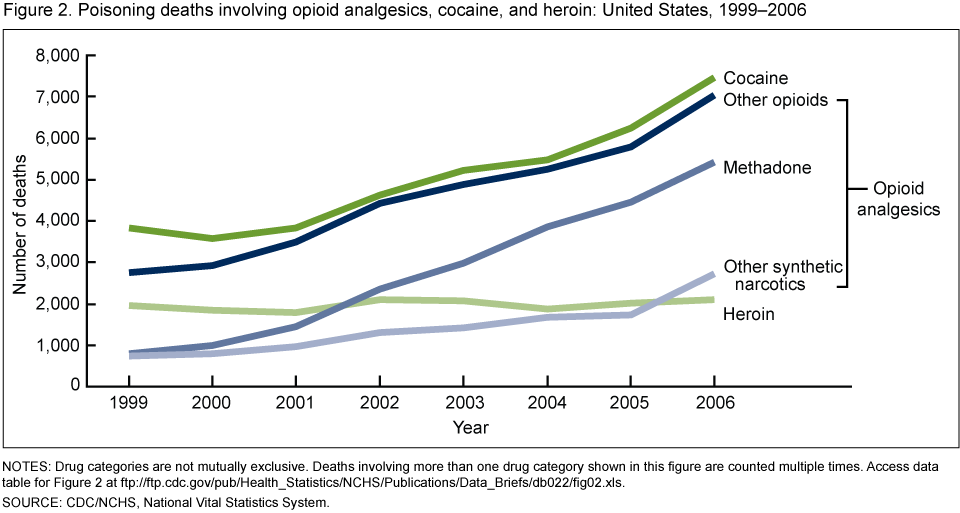
NOTES: Drug categories are not mutually exclusive. Deaths involving more than one drug category shown in this figure are counted multiple times. Access data table for Figure 2 [XLS - 18 KB]
SOURCE: CDC/NCHS, National Vital Statistics System.
The number of poisoning deaths involving methadone increased nearly sevenfold from almost 790 in 1999 to almost 5,420 in 2006, which is the most rapid increase among opioid analgesics and other narcotics involved in poisoning deaths (Figure 2). Between 2005 and 2006, the number of poisoning deaths involving other synthetic narcotics increased by more than 50%. This increase may be related to the illicit manufacture of nonpharmaceutical fentanyl in 2006 (5).
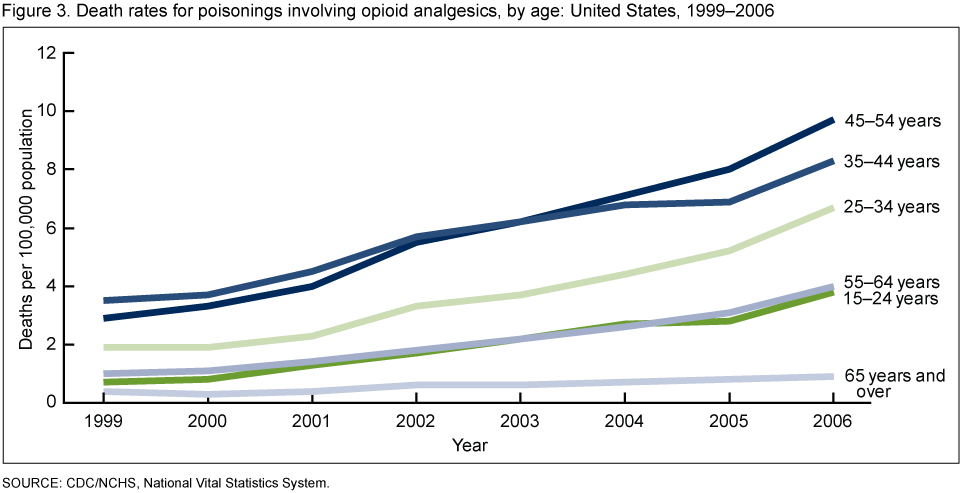
Throughout the period 1999-2006, people aged 35-54 years had higher poisoning death rates involving opioid analgesics than those in other age groups.
From 1999 to 2006, poisoning death rates involving opioid analgesics increased for every age group from 15-24 years through 65 years and older, males and females, and non-Hispanic white and non-Hispanic black persons (Appendix table).
Increases among age groups ranged from about twofold (65 years and over) to more than fivefold (15-24 years) (Figure 3). Males had higher age-adjusted poisoning death rates involving opioid analgesics than females throughout the period. In 2006, the rate for males was about 75% higher than for females. In 2006, the age-adjusted death rate for poisoning involving opioid analgesics among non-Hispanic white persons was about twice that of non-Hispanic black persons and almost three times that of Hispanic persons.
More than one type of drug was mentioned in the majority of poisoning deaths that involved opioid analgesics in 2006.
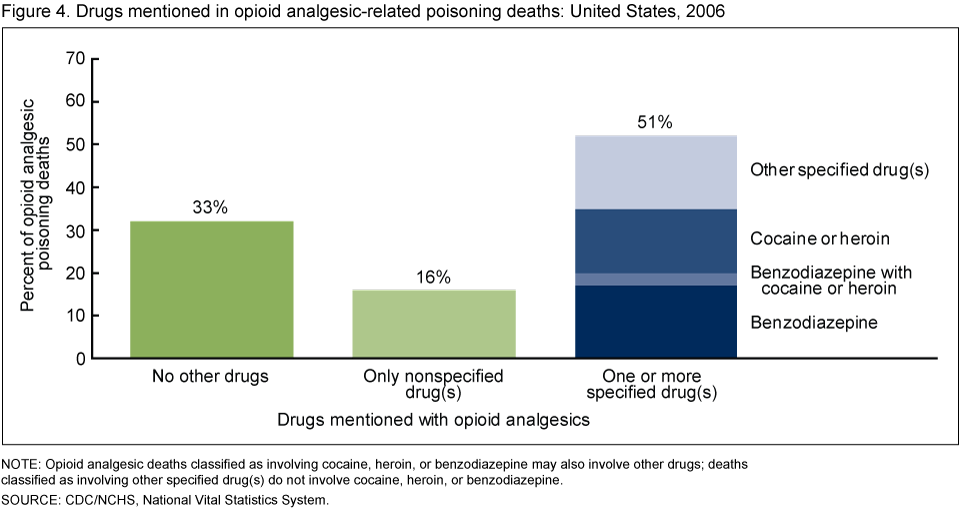
About one-third of opioid analgesic-related poisoning deaths involved no other drugs and 16% involved nonspecified drug(s) (Figure 4). Deaths with a nonspecified drug could potentially involve only opioid analgesics. About one-half of opioid analgesic-related deaths involved at least one other drug that was specified on the death certificate; benzodiazepines were involved in 17% of the deaths, cocaine or heroin in 15%, and benzodiazepines with cocaine or heroin in 3%.
Death rates for poisoning involving opioid analgesics varied more than eightfold among the states in 2006.
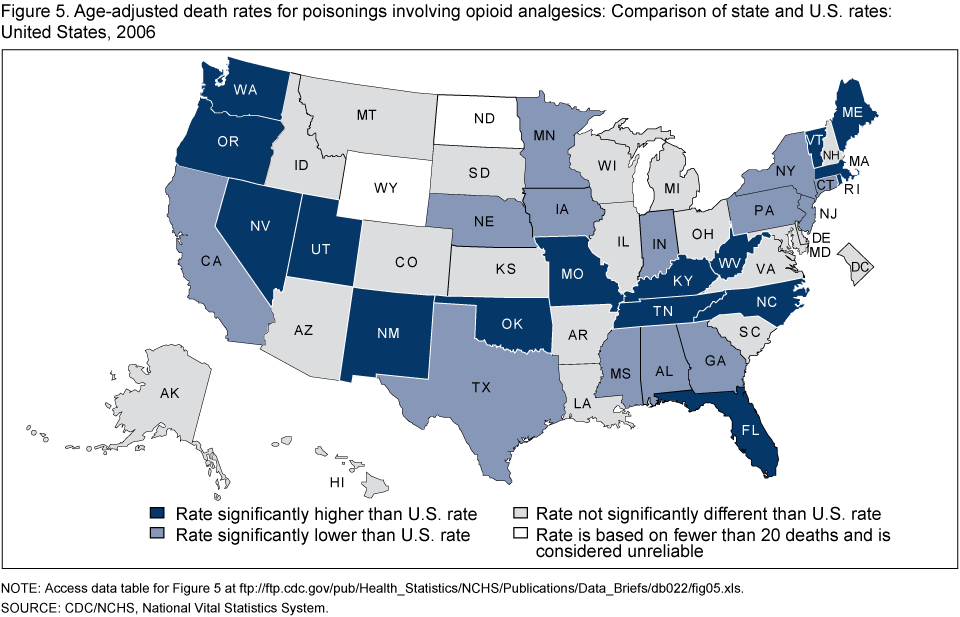
NOTE: Access data table for Figure 5 [XLS - 22 KB]
SOURCE: CDC/NCHS, National Vital Statistics System
In 2006, age-adjusted death rates for poisoning deaths involving opioid analgesics ranged from 1.8 to 15.6 deaths per 100,000 population among the states. In 16 states, the rate was statistically significantly higher than the U.S. rate of 4.6 deaths per 100,000 (Figure 5).
In 2006, West Virginia, Utah, New Mexico, Oklahoma, and Nevada had the five highest rates, ranging from 10.5 to 15.6 per 100,000. State-specific comparisons should be interpreted with caution as there is some variation in the reporting of substances on death records.
Summary
Opioid analgesics are drugs that are usually prescribed to treat pain. Poisoning death rates involving opioid analgesics have more than tripled in the United States since 1999. Among opioid analgesic-related deaths, those involving methadone increased the most during the period 1999-2006.
Methadone is a long-acting opioid and requires a complex dosing schedule. Methadone relieves pain for 4 to 8 hours, but remains in the body for up to 59 hours (6). A lack of knowledge about the unique properties of methadone was identified as contributing to some deaths (6).
Knowing whether other drugs are involved with opioid analgesics in poisoning deaths helps in developing prevention strategies. The data suggest that multiple drugs were involved in at least one-half of the opioid analgesic-related deaths. The involvement of benzodiazepines-sedatives used to treat anxiety, insomnia, and seizures-is particularly troubling as previous studies have shown that people who were prescribed both methadone and benzodiazepine were at greater risk of overdose than those prescribed only one of these drugs (7).
State variation in opioid analgesic-related death rates provides an opportunity to study factors associated with deaths involving opioid analgesics. States vary widely in their prescription and other drug policies (8). For instance, 32 states have operational drug monitoring programs with statewide databases that monitor the prescribing and dispensing of prescription drugs (9).
Opioid analgesics have abuse potential and are, therefore, a controlled substance under the U.S. Drug Enforcement Administration (DEA). Recent studies have shown a rise in distribution and prescription of opioids (10,11,12). It could not be determined from death certificates whether the opioid analgesics involved in poisoning deaths were prescribed for the decedent or obtained in another way. Several regional studies have shown that at least some decedents obtained opioid analgesics illegally (6,11).
Several government agencies are taking action on opioid analgesic-related poisonings including CDC, DEA, the National Institute on Drug Abuse, the Office of National Drug Control Policy, the Substance Abuse and Mental Health Services Administration, and the U.S. Food and Drug Administration.
The importance of opioid analgesics in the management of pain is unquestioned. However, increasing opioid analgesic-related poisoning deaths pose a serious public health risk.
Definitions
Narcotic refers to both opioid analgesics and illicit drugs including opium, heroin, and cocaine.
Opioid analgesics are drugs that are usually prescribed to relieve pain and include: methadone, which is used to treat opioid dependency as well as pain; other opioids, such as oxycodone and hydrocodone; and synthetic narcotics such as fentanyl and propoxyphene. Opium, heroin, and cocaine are not included in this class.
Poisoning deaths include those resulting from accidental or intentional overdoses of a drug, being given the wrong drug, taking the wrong drug in error, or taking a drug inadvertently. Poisoning deaths also include those involving biological or other toxic substances, gases, or vapors.
Data sources and methods
Estimates are based on the National Vital Statistics System multiple cause of death mortality files (13). Poisoning deaths were defined as those with an underlying cause of death classified to the International Classification of Diseases, Tenth Revision (ICD-10) external cause of injury codes X40-X49, X60-X69, X85-X90, Y10-Y19, Y35.2, or *U01(.6-.7) (14). Estimates are for poisoning deaths of any intent (unintentional, suicide, homicide or legal intervention, or undetermined) for U.S. residents.
Among deaths with poisoning as the underlying cause, the following ICD-10 codes indicate whether and the type of drug(s) involved: no drug (none of the codes T36-T50.9); drug(s) (any of the codes T36-T50.9); only nonspecified drug(s) (only T50.9); specified drug(s) other than opioid analgesic (any of the codes T36-T50.8 other than T40.2-T40.4); any opioid analgesic (any of the codes T40.2-T40.4); other opioid (T40.2); methadone (T40.3); other synthetic narcotic (T40.4); heroin (T40.1); cocaine (T40.5); and benzodiazepine (T42.4)
Age-adjusted death rates were calculated using the direct method and the 2000 standard population. To identify state rates that were significantly higher or lower than the overall U.S. rate, differences between national and state estimates were evaluated using two-sided significance tests at the 0.01 level.
Several factors related to death investigation and reporting may affect measurement of death rates involving specific drugs. At autopsy, toxicological lab tests may be performed to determine the type of legal and illegal drugs present. The substances tested for and circumstances in which the tests are performed vary by jurisdiction. Increased attention to fatal poisonings associated with prescription pain medication may have led to changes in reporting practices over time such as increasing the level of substance specific detail included on the death certificates. Substance specific death rates are more susceptible to measurement error related to these factors than the overall poisoning death rate.
Appendix Table A. Number of deaths for poisoning involving opioid analgesics: United States, 1999-2006.
| 1999 | 2000 | 2001 | 2002 | 2003 | 2004 | 2005 | 2006 | Ratio | ||
|---|---|---|---|---|---|---|---|---|---|---|
| 2006 to 19991 | 2006 to 2005 | |||||||||
| Number of deaths | ||||||||||
| Total | 4,041 | 4,419 | 5,538 | 7,475 | 8,535 | 9,876 | 10,947 | 13,755 | 3.4 | 1.3 |
See footnotes at end of Appendix Table E.
Appendix Table B. Death rates for poisoning involving opioid analgesics: United States, 1999-2006.
| 1999 | 2000 | 2001 | 2002 | 2003 | 2004 | 2005 | 2006 | Ratio | ||
|---|---|---|---|---|---|---|---|---|---|---|
| 2006 to 19991 | 2006 to 2005 | |||||||||
| Deaths per 100,000 population | ||||||||||
| Total2 | 1.4 | 1.6 | 1.9 | 2.6 | 2.9 | 3.4 | 3.7 | 4.6 | 3.3 | 1.2 |
See footnotes at end of Appendix Table E.
Appendix Table C. Death rates for poisoning involving opioid analgesics, by age: United States, 1999-2006.
| 1999 | 2000 | 2001 | 2002 | 2003 | 2004 | 2005 | 2006 | Ratio | ||
|---|---|---|---|---|---|---|---|---|---|---|
| 2006 to 19991 | 2006 to 2005 | |||||||||
| Age | Deaths per 100,000 population | |||||||||
| Under 15 years | * | 0.0 | 0.0 | 0.1 | 0.1 | 0.1 | 0.1 | 0.1 | * | 1.0 |
| 15-24 years | 0.7 | 0.8 | 1.3 | 1.7 | 2.2 | 2.7 | 2.8 | 3.8 | 5.4 | 1.4 |
| 25-34 years | 1.9 | 1.9 | 2.3 | 3.3 | 3.7 | 4.4 | 5.2 | 6.7 | 3.5 | 1.3 |
| 35-44 years | 3.5 | 3.7 | 4.5 | 5.7 | 6.2 | 6.8 | 6.9 | 8.3 | 2.4 | 1.2 |
| 45-54 years | 2.9 | 3.3 | 4.0 | 5.5 | 6.2 | 7.1 | 8.0 | 9.7 | 3.3 | 1.2 |
| 55-64 years | 1.0 | 1.1 | 1.4 | 1.8 | 2.2 | 2.6 | 3.1 | 4.0 | 4.0 | 1.3 |
| 65 years and over | 0.4 | 0.3 | 0.4 | 0.6 | 0.6 | 0.7 | 0.8 | 0.9 | 2.3 | 1.1 |
See footnotes at end of Appendix Table E.
Appendix Table D. Death rates for poisoning involving opioid analgesics, by sex: United States, 1999-2006.
| 1999 | 2000 | 2001 | 2002 | 2003 | 2004 | 2005 | 2006 | Ratio | ||
|---|---|---|---|---|---|---|---|---|---|---|
| 2006 to 19991 | 2006 to 2005 | |||||||||
| Sex2 | Deaths per 100,000 population | |||||||||
| Male | 2.0 | 2.1 | 2.5 | 3.3 | 3.7 | 4.2 | 4.5 | 5.8 | 2.9 | 1.3 |
| Female | 0.9 | 1.1 | 1.4 | 1.9 | 2.1 | 2.5 | 2.8 | 3.3 | 3.7 | 1.2 |
See footnotes at end of Appendix Table E.
Appendix Table E. Death rates for poisoning involving opioid analgesics, by race and Hispanic origin: United States, 1999-2006.
| 1999 | 2000 | 2001 | 2002 | 2003 | 2004 | 2005 | 2006 | Ratio | ||
|---|---|---|---|---|---|---|---|---|---|---|
| 2006 to 19991 | 2006 to 2005 | |||||||||
| Race and Hispanic origin2 | Deaths per 100,000 population | |||||||||
| Hispanic | 1.7 | 1.2 | 1.2 | 1.5 | 1.6 | 1.5 | 1.6 | 2.0 | 1.2 | 1.3 |
| Non-Hispanic white | 1.6 | 1.8 | 2.4 | 3.2 | 3.7 | 4.3 | 4.7 | 5.8 | 3.6 | 1.2 |
| Non-Hispanic black | 0.9 | 0.9 | 1.1 | 1.3 | 1.3 | 1.5 | 1.8 | 2.7 | 3.0 | 1.5 |
* Figure does not meet standards of reliability or precision. Rate is based on fewer than 20 deaths and is considered unreliable.
0.0 Quantity more than zero but less than 0.05.
1 Interpret the ratio of 2006 to 1999 for the total number of deaths as follows: the number of deaths in 2006 was 3.4 times the number in 1999.
2 Age-adjusted death rates were calculated using the direct method and the 2000 standard population.
NOTES: Poisoning deaths involving opioid analgesics are deaths classified with an International Classification of Diseases, Tenth Revision code of X40-X49, X60-X69, X85-X90, Y10-Y19, Y35.2, or *U01(.6-.7) as an underlying cause of death and any mention of T40.2, T40.3, or T40.4 as a multiple cause. Opioid analgesics are drugs that are generally used to relieve pain, (see "Definitions " section).
SOURCE: CDC/NCHS, National Vital Statistics System.
About the authors
Margaret Warner, Li Hui Chen, and Diane M. Makuc are with the Centers for Disease Control and Prevention’s National Center for Health Statistics, Office of Analysis and Epidemiology.
References
- CDC. QuickStats from the National Center for Health Statistics. Age-adjusted death rates for the three leading causes of injury death-United States, 1979-2006. MMWR 58(24);675. 2009.
- CDC. QuickStats from the National Center for Health Statistics. Motor-vehicle traffic and poisoning death rates, by age-United States, 2005-2006. MMWR 58(27);753. 2009.
- Fingerhut LA. Increases in poisoning and methadone-related deaths: United States, 1999-2005. National Center for Health Statistics. Health E-Stat. 2008.
- Paulozzi LJ, Budnitz DS, Xi Y. Increasing deaths from opioid analgesics in the United States. Pharmacoepidemiol Drug Saf 15(9):618-27. 2006.
- CDC. Nonpharmaceutical fentanyl-related deaths-Multiple states, April 2005-March 2007. MMWR 57(29);793-6. 2008.
- Government Accountability Office. Methadone-associated overdose deaths: Factors contributing to increased deaths and efforts to prevent them [PDF - 1.7 MB]. Washington: U.S. Government Accountability Office. 2009.
- McCowan C, Kidd B, Fahey T. Factors associated with mortality in Scottish patients receiving methadone in primary care: Retrospective cohort study. BMJ 338:b2225. 2009.
- National Alliance for Model State Drug Laws. State controlled substance information.
- U.S. Department of Justice. Drug Enforcement Administration. State prescription drug monitoring programs.
- Pletcher MJ, Kertesz SG, Kohn MA, Gonzales R. Trends in opioid prescribing by race/ethnicity for patients seeking care in US emergency departments. JAMA 299(1):70-8. 2008.
- Hall AJ, Logan JE, Toblin RL, Kaplan JA, Kraner JC, Bixler D, et al. Patterns of abuse among unintentional pharmaceutical overdose fatalities. JAMA 300(22):2613-20. 2008.
- Manchikanti L, Singh A. Therapeutic opioids: A ten-year perspective on the complexities and complications of the escalating use, abuse, and nonmedical use of opioids. Pain Physician 11(2 Suppl):S63-88. 2008.
- Heron MP, Hoyert DL, Murphy SL, et al. Deaths: Final data for 2006 [PDF - 1.7 MB]. National vital statistics reports; vol 57 no 14. Hyattsville, MD: National Center for Health Statistics. 2009.
- World Health Organization. International Statistical Classification of Diseases and Related Health Problems, Tenth Revision.
Suggested citation
Warner M, Chen LH, Makuc DM. Increase in fatal poisonings involving opioid analgesics in the United States, 1999-2006. NCHS data brief, no 22. Hyattsville, MD: National Center for Health Statistics. 2009.
Copyright information
All material appearing in this report is in the public domain and may be reproduced or copied without permission; citation as to source, however, is appreciated.
National Center for Health Statistics
Director
Edward J. Sondik, Ph.D
Acting Co-Deputy Directors
Jennifer H. Madans, Ph.D.
Michael H. Sadagursky
- Page last reviewed: November 6, 2015
- Page last updated: September 30, 2009
- Content source: