

Self-reported Hearing Trouble in Adults Aged 18 and Over: United States, 2014
 ShareCompartir
NCHS Data Brief No. 214, September 2015
On This Page
- Key findings
- What percentage of adults had any self-reported trouble hearing without a hearing aid?
- What was the degree of self-reported hearing loss among men and women who had any trouble hearing without a hearing aid?
- What were the main causes of hearing loss among men and women who had any trouble hearing without a hearing aid?
- What percentage of adults with any trouble hearing had seen a health care professional about any hearing or ear problems in the past 5 years?
- What percentage of adults who had any trouble hearing had ever used a hearing aid or assistive technology to communicate?
- Summary
- Definitions
- Data source and methods
- About the authors
- References
- Suggested citation
PDF Version (706 KB)
Carla E. Zelaya, Ph.D., M.Sc.; Jacqueline W. Lucas, M.P.H.; and Howard J. Hoffman, M.A.
Key findings
- Among adults aged 18–39, 5.5% had any self-reported trouble hearing without a hearing aid. The rate was 19.0% among adults aged 40–69 and 43.2% among adults aged 70 and over. The majority of these adults (62.6%) had mild hearing loss.
- Among women, 45.3% stated that getting older was the main cause of their hearing loss, compared with 24.5% of men. Nearly 36% of men stated that long-term noise exposure was the main cause of their hearing loss, compared with nearly 11% of women.
- Of adults who had any trouble hearing, 46.0% had seen a health professional about their hearing in the past 5 years.
- Among adults who had any trouble hearing, those aged 70 and over were more likely to have used a hearing aid, while those aged 18–39 were more likely to have used other assistive technology.
Untreated hearing loss is associated with decreasing social, psychological, and cognitive functioning (1–4). Using data from the 2014 National Health Interview Survey (NHIS), this data brief reports the percentage of U.S. adults who had any trouble hearing without a hearing aid (defined as having at least “a little trouble hearing”). Information is provided on the degree of loss, selected causes of trouble hearing, sought-after care for hearing problems, and use of assistive devices and technology to communicate.
Keywords: hearing loss, hearing aids, assistive technology to communicate, National Health Interview Survey
What percentage of adults had any self-reported trouble hearing without a hearing aid?
In 2014, one in six adults aged 18 and over (16.8%) had any self-reported trouble hearing without a hearing aid (Figure 1). The percentage with any trouble hearing increased significantly overall with age: 5.5% among adults aged 18–39, 19.0% among adults aged 40–69, and 43.2% among adults aged 70 and over. In each age group, men were more likely than women to have had trouble hearing. Among adults aged 70 and over, 52.4% of men had trouble hearing without a hearing aid compared with 36.2% of women.
Figure 1. Adults who had any self-reported trouble hearing without a hearing aid, by sex and age group: United States, 2014
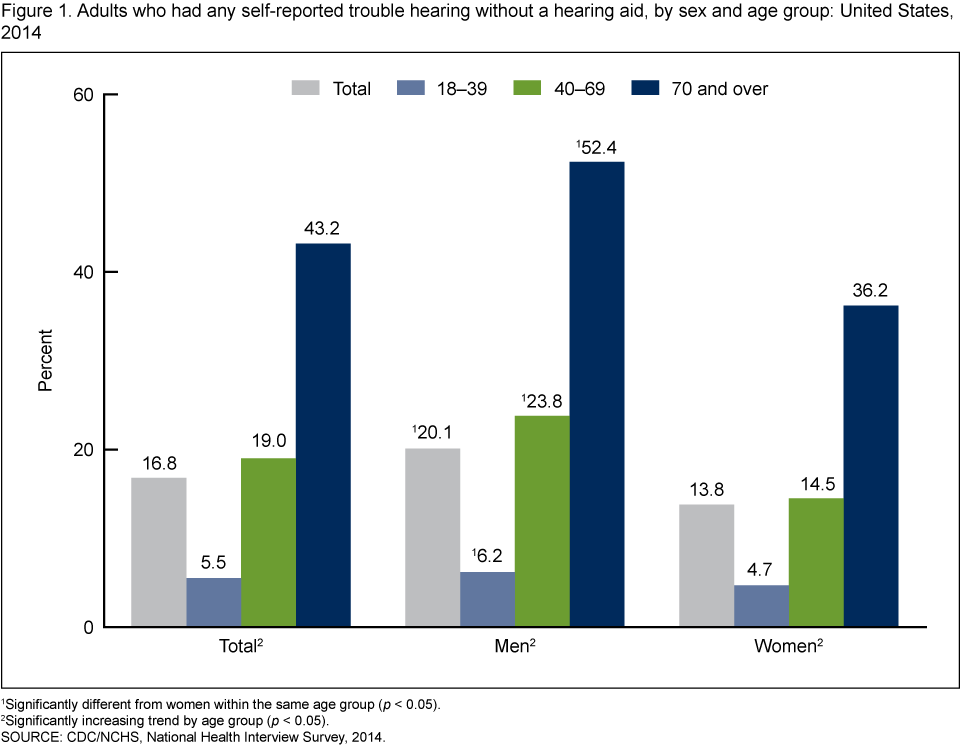
1Significantly different from women within the same age group (p < 0.05).
2Significantly increasing trend by age group (p < 0.05).
SOURCE: CDC/NCHS, National Health Interview Survey, 2014.
What was the degree of self-reported hearing loss among men and women who had any trouble hearing without a hearing aid?
The majority of adults who had trouble hearing had mild hearing loss, defined as “a little trouble hearing” (62.6%) (Figure 2). Less than 2% of adults who indicated that they had any trouble hearing were deaf. Overall, 0.29% of U.S. adults were deaf (data not shown).
There were differences by sex in the degree of self-reported hearing loss. Men were less likely than women to classify their hearing loss as “a little trouble hearing” and were more likely to classify their hearing loss as “moderate trouble” hearing. However, there were no significant differences by sex in the proportion of adults who indicated that they had “a lot of trouble” hearing or that they were deaf.
Figure 2. Degree of self-reported hearing loss among men and women who had any trouble hearing without a hearing aid: United States, 2014
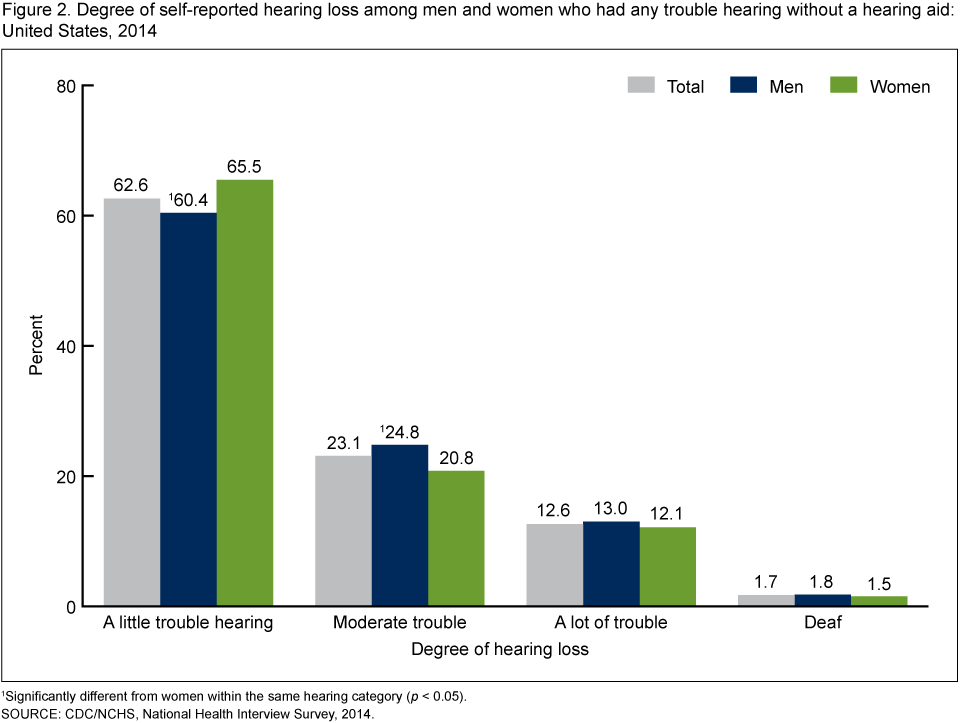
1Significantly different from women within the same hearing category (p < 0.05).
SOURCE: CDC/NCHS, National Health Interview Survey, 2014.
What were the main causes of hearing loss among men and women who had any trouble hearing without a hearing aid?
In 2014, long-term noise exposure (e.g., from machinery or power tools) was more likely to be cited as a main cause of hearing loss among men (35.6%) compared with women (10.8%) (Figure 3). Similarly, loud, brief noise (e.g., from gunfire or other blasts or explosions) was more likely to be cited as a cause of hearing loss among men (14.8%) compared with women (2.1%). Nearly one-half of women (45.3%) cited that getting older or aging was the main cause of their hearing loss compared with nearly one-quarter of men (24.5%). Women were more than twice as likely to cite ear infections or otitis media as the main cause of their hearing loss (10.9%) compared with men (4.7%). Ear injury or head or neck trauma and causes present at birth (e.g., hearing loss due to genetics or infectious disease during gestation) were infrequently cited causes of hearing loss.
Figure 3. Selected self-reported causes of hearing loss among men and women who had any trouble hearing without a hearing aid: United States, 2014
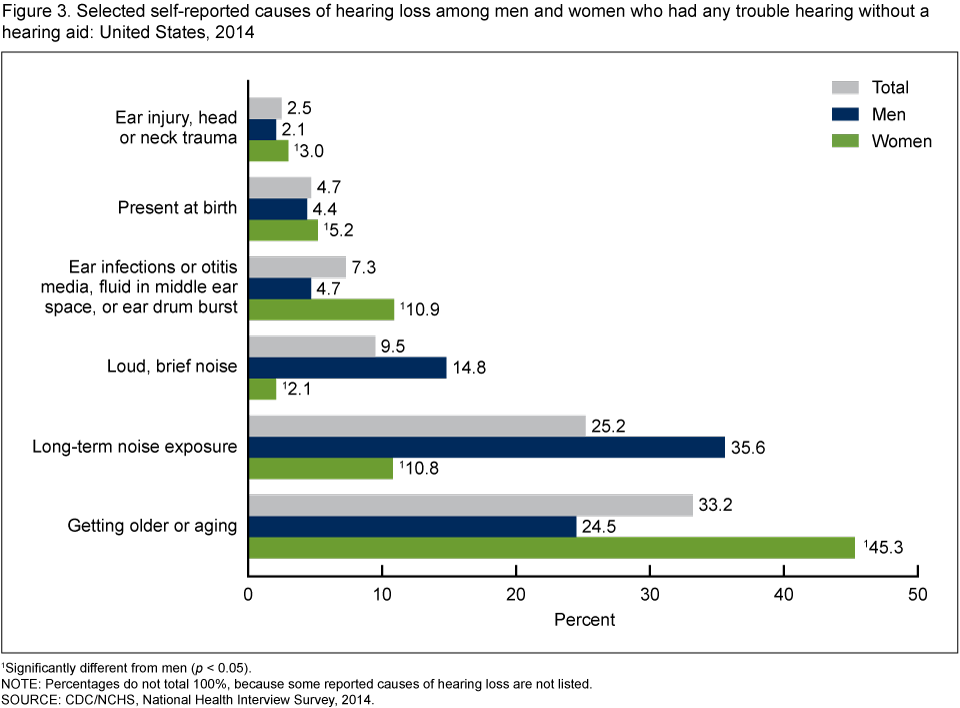
1Significantly different from men (p < 0.05).
NOTE: Percentages do not total 100%, because some reported causes of hearing loss are not listed.
SOURCE: CDC/NCHS, National Health Interview Survey, 2014.
What percentage of adults with any trouble hearing had seen a health care professional about any hearing or ear problems in the past 5 years?
Among adults aged 18 and over who had any trouble hearing without a hearing aid, less than one-half (46.0%) had seen a doctor or other health professional about their hearing or ear problems in the past 5 years (Figure 4). There were no significant differences in the percentages of men and women who had seen a health care professional, regardless of age. Also, there were no significant differences between adults aged 18–39 and adults aged 40–69, regardless of sex. But the likelihood of having seen a doctor or health care professional was significantly higher among adults aged 70 and over (56.8%) compared with adults aged 40–69 (41.6%).
Figure 4. Adults who had seen a doctor or other health professional about hearing or ear problems in the past 5 years, by age group among those who had any trouble hearing without a hearing aid: United States, 2014
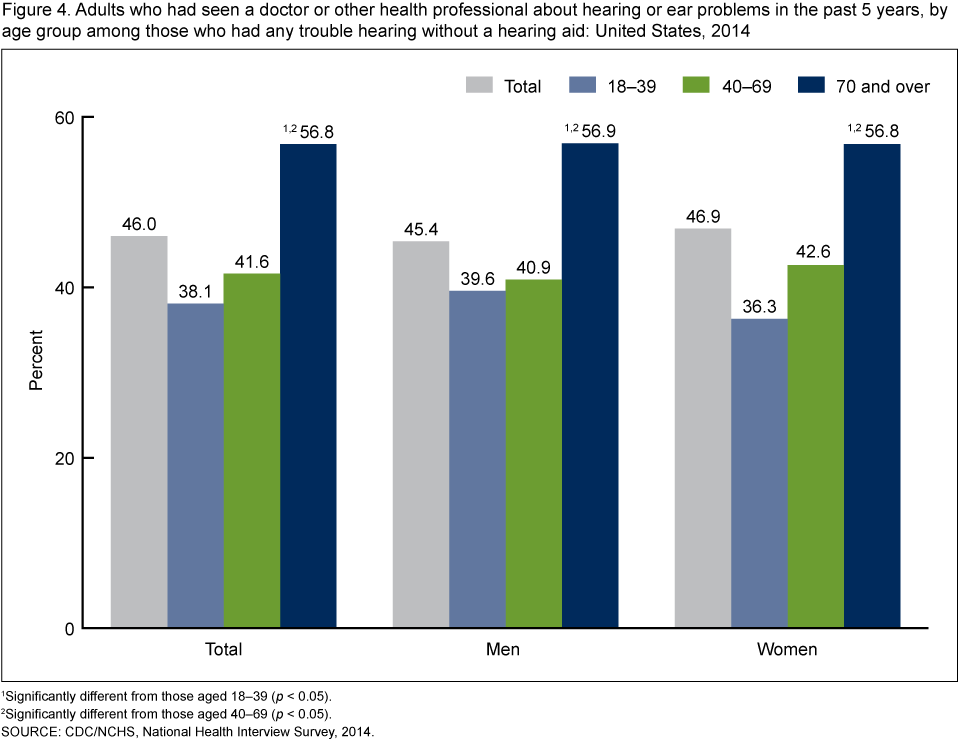
1Significantly different from those aged 18–39 (p < 0.05).
2Significantly different from those aged 40–69 (p < 0.05).
SOURCE: CDC/NCHS, National Health Interview Survey, 2014.
What percentage of adults who had any trouble hearing had ever used a hearing aid or assistive technology to communicate?
Almost 22% of adults who had any trouble hearing without a hearing aid had ever used a hearing aid, while approximately 9% had ever used assistive technology to communicate, such as FM systems, instant or text messages, or amplified telephones (Figure 5). But the likelihood of having ever used hearing aids almost tripled for each age group, from 4.7% among adults aged 18–39, to 13.5% among adults aged 40–69, to 42.0% among adults aged 70 and over. This threefold increase for each successive age group was not seen for the use of assistive technology. A history of using assistive technology was more prevalent in the youngest age group (12.1%), with the middle age group being the least likely to use assistive technology (7.7% among adults aged 40–69).
Figure 5. Adults who had ever used a hearing aid or assistive technology to communicate, by age group among those who had any trouble hearing without a hearing aid: United States, 2014
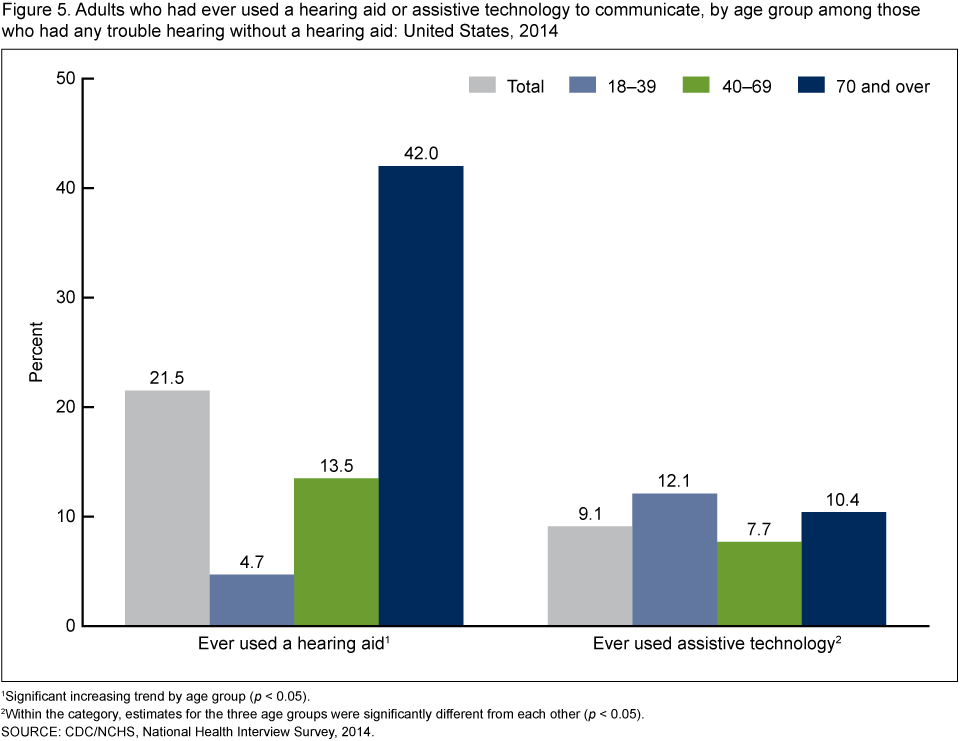
1Significant increasing trend by age group (p < 0.05).
2Within the category, estimates for the three age groups were significantly different from each other (p < 0.05).
SOURCE: CDC/NCHS, National Health Interview Survey, 2014.
Summary
Age is typically the most significant determinant of hearing loss (5,6). Among U.S. adults in 2014, self-reported hearing loss was most prevalent among adults aged 70 and over (43.2%), compared with adults aged 40–69 (19.0%) and aged 18–39 (5.5%). Age-related hearing loss is often overlooked due to its deceptively slow progression, lack of attention from providers, and public acceptance as a condition that is perceived to be a “normal” consequence of aging (7).
Among U.S. adults aged 70 and over who had any trouble hearing, 56.8% had seen a doctor or other health care professional about their hearing or ear problems in the past 5 years, but only 42.0% had ever used a hearing aid. Younger adults (aged 18–39) who had any trouble hearing were even less likely to have seen a doctor or used a hearing aid, but they were more likely to have used other assistive technology because of their hearing compared with adults aged 40–69 or 70 and over.
Among U.S. adults who had any trouble hearing without a hearing aid, 1.7% were deaf, but the majority (62.6%) had mild hearing loss (defined as “a little trouble hearing”). Men were more likely than women to have self-reported trouble hearing, a sex disparity that has been documented globally among all age groups (8). Men were also more likely than women to state they had moderate trouble hearing.
The main self-reported causes of hearing loss also varied by sex. U.S. women were much more likely to cite aging as the main cause of their hearing loss compared with men. Loud, brief noise and long-term noise exposure were much more common causes given for hearing loss among men than women.
Definitions
Any trouble hearing without a hearing aid: Defined as a response of “a little trouble hearing,” “moderate trouble,” “a lot of trouble,” or “deaf” to the question, “These next questions are about your hearing without the use of hearing aids or other listening devices. Is your hearing excellent, good, [do you have] a little trouble hearing, moderate trouble, a lot of trouble, or are you deaf?”
Main causes of hearing loss: Based on responses to the question, “What is the main cause of your hearing loss?” The question was asked of respondents who had any trouble hearing without a hearing aid. Interviewers coded the responses into the following categories:
- Present at birth because mother had infectious disease (e.g., German measles [rubella], cytomegalovirus [CMV], toxoplasmosis, etc.)
- Present at birth for a genetic reason
- Present at birth for other reason (e.g., preterm birth [NOT genetic or infectious disease])
- After birth due to an infectious disease (measles, meningitis, mumps, etc.)
- Ear infections or otitis media, fluid in middle ear space, or ear drum burst (perforation)
- Ear injury or head or neck trauma
- Ear surgery
- Medications or drugs, such as gentamicin (aminoglycosides), cisplatin (cancer drugs), antibiotics, anti-inflammatory drugs, or diuretic
- Ear disease such as Meniere’s disease or otosclerosis
- Brain tumor (acoustic neuroma or vestibular schwannoma)
- Loud, brief noise from gunfire, hand grenade, IED (improvised explosive devise), or other blasts or explosions
- Sudden hearing loss, unexplained by loud, brief noise or other known causes
- Long-term noise exposure from machinery, aircraft, power tools, loud music, appliances, personal stereos or MP3 players, hair dryers, etc.
- Getting older or aging
- Some other cause
In Figure 3, some categories were combined and some reported causes of hearing loss were not included.
Seen a doctor or other health care professional about hearing or ear problems in the past 5 years: Based on respondent answers of “In the past year,” “1 to 2 years ago,” or “3 to 4 years ago” when asked, “When was the last time you saw a doctor or other health care professional about any hearing or ear problems? Never, in the past year, 1 to 2 years ago, 3 to 4 years ago, 5 to 9 years ago, 10 to 14 years ago.”
Ever used assistive technology to communicate: Based on responding positively when asked, “Because of your hearing, have you ever used assistive technology to communicate, such as FM systems, instant or text messages, headsets, closed-caption television, amplified telephone, relay services, or live video streaming?”
Data source and methods
Data from the 2014 NHIS were used for this analysis. NHIS data are collected continuously throughout the year for the Centers for Disease Control and Prevention’s (CDC) National Center for Health Statistics (NCHS) by interviewers from the U.S. Census Bureau. NHIS collects information about the health and health care of the civilian noninstitutionalized population of the United States. Interviews are conducted in respondents’ homes, but follow-ups to complete interviews may be conducted over the telephone. The survey consists of a core set of questions that remains relatively unchanged from year to year and supplemental questions that are not asked every year. The question about trouble hearing is a core question that is asked of one randomly selected adult (the “sample adult”) from each interviewed family.
Additional questions about hearing shown in this report are from a hearing supplement that collected additional data in 2014 from the sample adult. The supplement was developed and implemented with collaboration and funding from the National Institutes of Health’s National Institute on Deafness and Other Communication Disorders. In 2014, information was collected on 36,697 sample adults aged 18 and over. For further information about NHIS, including the questionnaire, visit the NHIS website.
NHIS is designed to yield a nationally representative sample, and this analysis used weights to produce national estimates. The sample design and data weighting procedures are described in more detail elsewhere ( 9). Point estimates and estimates of corresponding variance were calculated using the SUDAAN software package ( 10) to account for the complex sample design of NHIS. All estimates shown in this report meet the NCHS standard of reliability (relative standard error less than or equal to 30%). Differences between percentages were evaluated using two-sided significance tests at the 0.05 level.
About the authors
Carla E. Zelaya and Jacqueline W. Lucas are with CDC’s National Center for Health Statistics, and Howard J. Hoffman is with the National Institutes of Health’s National Institute on Deafness and Other Communication Disorders.
References
- Mulrow CD, Aguilar C, Endicott JE, Tuley MR, Velez R, Charlip WS, et al. Quality-of-life changes and hearing impairment. A randomized trial. Ann Intern Med 113(3):188–94. 1990.
- Lin FR, Metter EJ, O’Brien RJ, Resnick SM, Zonderman AB, Ferrucci L. Hearing loss and incident dementia. Arch Neurol 68(2):214–20. 2011.
- Li CM, Zhang X, Hoffman HJ, Cotch MF, Themann CL, Wilson MR. Hearing impairment associated with depression in US adults, National Health and Nutrition Examination Survey 2005–2010. JAMA Otolaryngol Head Neck Surg 140(4):293–302. 2014.
- Saito H, Nishiwaki Y, Michikawa T, Kikuchi Y, Mizutari K, Takebayashi T, Ogawa K. Hearing handicap predicts the development of depressive symptoms after 3 years in older community-dwelling Japanese. J Am Geriatr Soc 58(1):93–7. 2010.
- Lee FS, Mathews LJ, Dubno JR, Mills JH. Longitudinal study of pure-tone thresholds in older persons. Ear Hear 26(1):1–11. 2005.
- Dobie RA. The burdens of age-related and occupational noise-induced hearing loss in the United States. Ear Hear 29(4):565–77. 2008.
- Wallhagen MI, Pettengill E. Hearing impairment: significant but underassessed in primary care settings. J Gerontol Nurs 34(2):36–42. 2008.
- Stevens G, Flaxman S, Brunskill E, Mascarenhas M, Mathers CD, Finucare M, Global Burden of Disease Hearing Loss Expert Group. Global and regional hearing impairment prevalence: An analysis of 42 studies in 29 countries. Eur J Public Health 23(1):146–52. 2013.
- Parsons VL, Moriarity CL, Jonas K, et al. Design and estimation for the National Health Interview Survey, 2006–2015. National Center for Health Statistics. Vital Health Stat 2(165). 2014.
- RTI International. SUDAAN (Release 11.0.0) [computer software]. 2012.
Suggested citation
Zelaya CE, Lucas JW, Hoffman HJ. Self-reported hearing trouble in adults aged 18 and over: United States, 2014. NCHS data brief, no 214. Hyattsville, MD: National Center for Health Statistics. 2015.
Copyright information
All material appearing in this report is in the public domain and may be reproduced or copied without permission; citation as to source, however, is appreciated.
National Center for Health Statistics
Charles J. Rothwell, M.S., M.B.A., Director
Nathaniel Schenker, Ph.D., Deputy Director
Jennifer H. Madans, Ph.D., Associate Director for Science
Division of Health Interview Statistics
Marcie L. Cynamon, Director
- Page last reviewed: November 6, 2015
- Page last updated: September 17, 2015
- Content source: