

Health Care Access and Utilization Among Adults Aged 18–64, by Race and Hispanic Origin: United States, 2013 and 2014
 ShareCompartir
NCHS Data Brief No. 208, July 2015
On This Page
- Key findings
- Did the percentage of uninsured adults change from 2013 to 2014 for selected race and Hispanic origin subgroups?
- Did the percentage of adults with a usual place to go for medical care change from 2013 to 2014 for selected race and Hispanic origin subgroups?
- Did the percentage of adults who had seen or talked to a health care professional in the past 12 months change from 2013 to 2014 for selected race and Hispanic origin subgroups?
- Did the percentage of adults who did not obtain needed medical care due to cost change from 2013 to 2014 for selected race and Hispanic origin subgroups?
- Summary
- Definitions
- Data source and methods
- About the authors
- References
- Suggested citation
PDF Version (663 KB)
Michael E. Martinez, M.P.H., M.H.S.A.; Brian W. Ward, Ph.D.; and Patricia F. Adams
Key findings
Data from the National Health Interview Survey, 2013 and 2014
- Compared with 2013, adults aged 18–64 who were uninsured at the time of interview decreased in 2014 for Hispanic (41.1% to 34.1%), non-Hispanic white (14.5% to 11.5%), non-Hispanic black (24.7% to 17.6%), and non-Hispanic Asian (16.1% to 12.1%) adults.
- Adults aged 18–64 who had a usual place to go for medical care increased in 2014 for Hispanic (69.1% to 73.0%) and non-Hispanic white (84.3% to 85.6%) adults.
- Adults aged 18–64 who had seen or talked to a health care professional in the past 12 months increased in 2014 for Hispanic (67.5% to 70.1%) adults.
- Adults aged 18–64 who did not obtain needed medical care due to cost at some time during the past 12 months decreased in 2014 for Hispanic (9.9% to 7.6%) and non-Hispanic white (7.7% to 7.0%) adults.
In 2014, U.S. adults could buy a private health insurance plan through the Health Insurance Marketplace or state-based exchanges established as part of the Affordable Care Act. Moreover, some states opted to expand Medicaid coverage to low-income adults. Data from the 2013 and 2014 National Health Interview Survey (NHIS) are used to describe recent changes in health insurance coverage and selected measures of health care access and utilization for adults aged 18–64, by race and Hispanic origin.
Keywords: ethnicity, Affordable Care Act, medical care, National Health Interview Survey
Did the percentage of uninsured adults change from 2013 to 2014 for selected race and Hispanic origin subgroups?
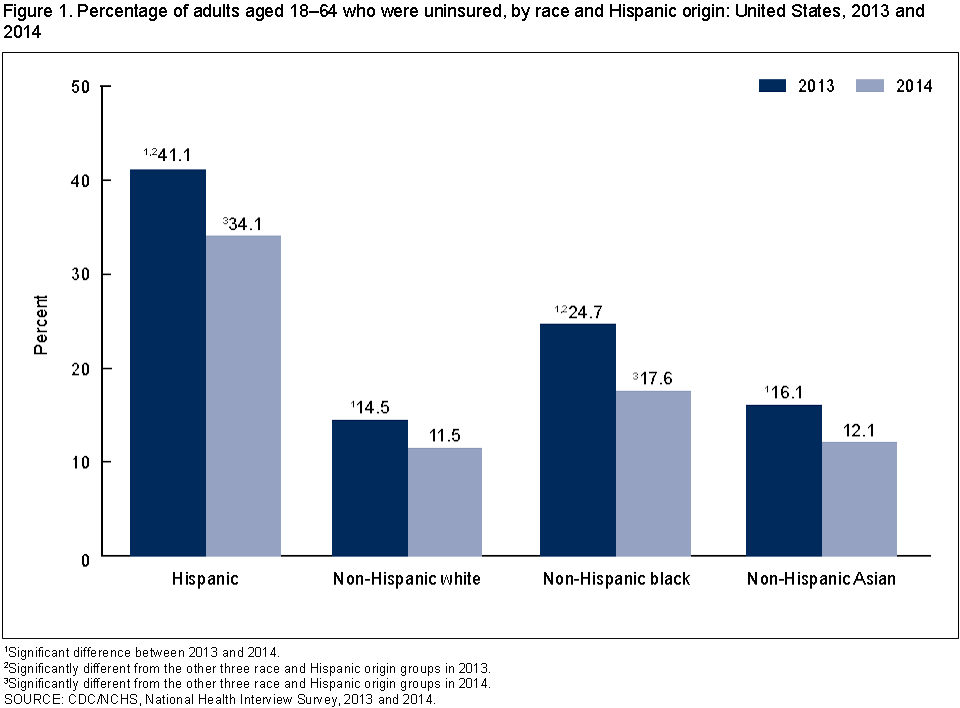
- Compared with 2013, the percentage of adults aged 18–64 who were uninsured at the time of interview decreased in 2014 for Hispanic (41.1% to 34.1%), non-Hispanic white (14.5% to 11.5%), non-Hispanic black (24.7% to 17.6%), and non-Hispanic Asian (16.1% to 12.1%) adults (Figure 1).
Figure 1. Percentage of adults aged 18–64 who were uninsured, by race and Hispanic origin: United States, 2013 and 2014
1Significant difference between 2013 and 2014.
2Significantly different from the other three race and Hispanic origin groups in 2013.
3Significantly different from the other three race and Hispanic origin groups in 2014.
SOURCE: CDC/NCHS, National Health Interview Survey, 2013 and 2014.
- In 2013 and 2014, Hispanic adults aged 18–64 were the most likely to be uninsured at the time of interview.
- In 2013 and 2014, non-Hispanic white and non-Hispanic Asian adults were the least likely to be uninsured.
Did the percentage of adults with a usual place to go for medical care change from 2013 to 2014 for selected race and Hispanic origin subgroups?
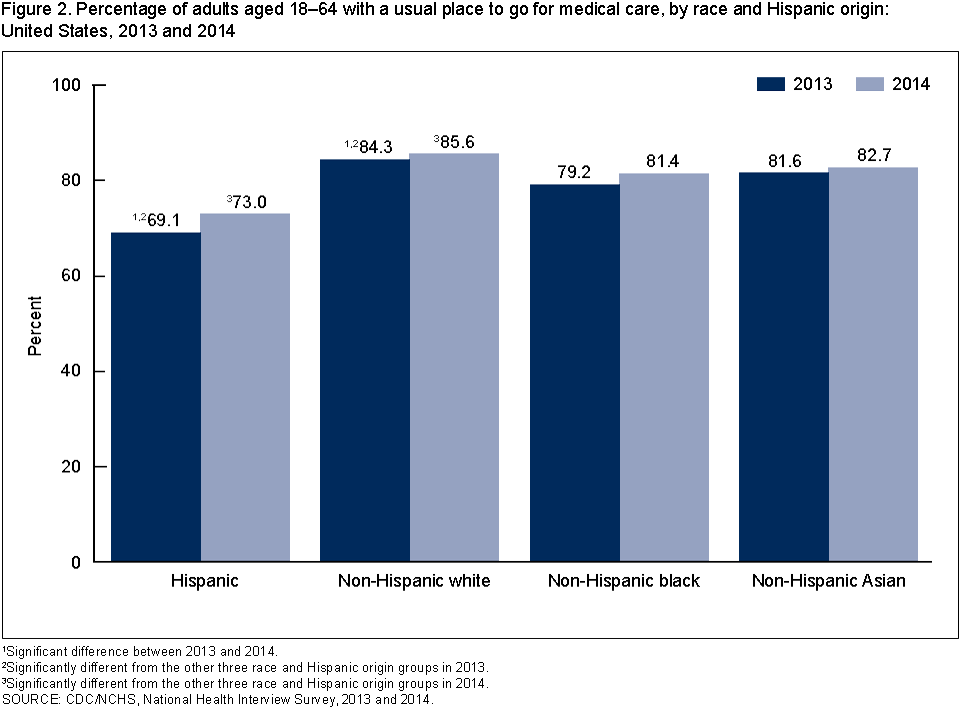
- Compared with 2013, the percentage of adults aged 18–64 who had a usual place to go for medical care increased in 2014 for Hispanic (69.1% to 73.0%) and non-Hispanic white (84.3% to 85.6%) adults (Figure 2).
- The percentage of adults aged 18–64 who had a usual place to go for medical care did not change significantly between 2013 and 2014 for non-Hispanic black and non-Hispanic Asian adults.
- In 2013 and 2014, Hispanic adults aged 18–64 were the least likely to have a usual place to go for medical care.
- In 2013 and 2014, non-Hispanic white adults aged 18–64 were the most likely to have a usual place to go for medical care.
Figure 2. Percentage of adults aged 18–64 with a usual place to go for medical care, by race and Hispanic origin: United States, 2013 and 2014
1Significant difference between 2013 and 2014.
2Significantly different from the other three race and Hispanic origin groups in 2013.
3Significantly different from the other three race and Hispanic origin groups in 2014.
SOURCE: CDC/NCHS, National Health Interview Survey, 2013 and 2014.
Did the percentage of adults who had seen or talked to a health care professional in the past 12 months change from 2013 to 2014 for selected race and Hispanic origin subgroups?
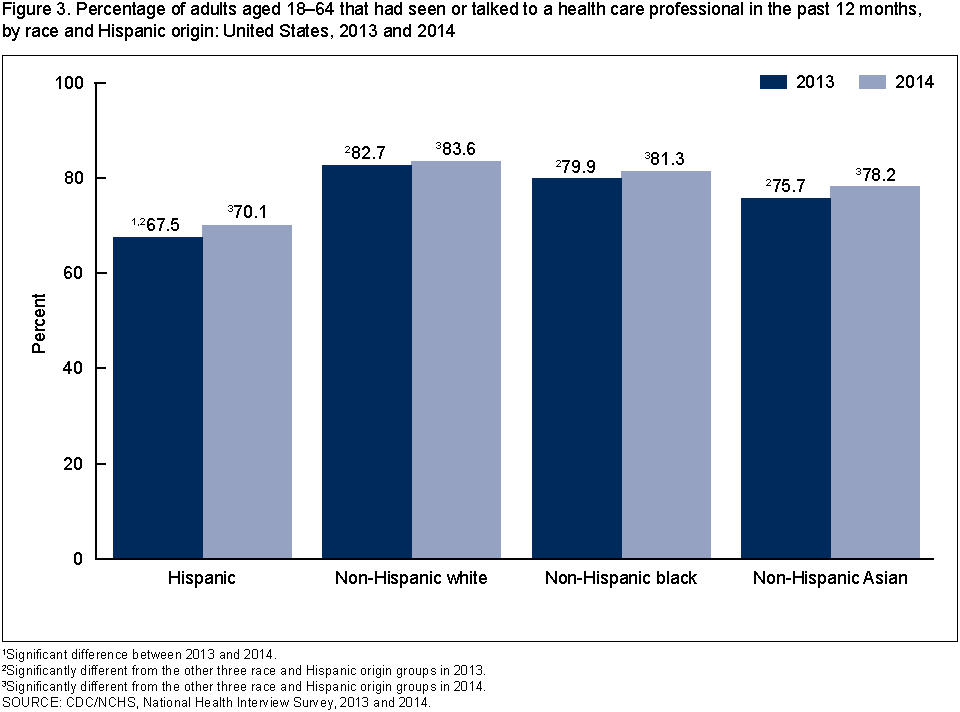
- Compared with 2013, the percentage of adults aged 18–64 who had seen or talked to a health care professional in the past 12 months increased in 2014 for Hispanic adults (67.5% to 70.1%) (Figure 3).
- The percentage of adults aged 18–64 who had seen or talked to a health care professional in the past 12 months did not change significantly between 2013 and 2014 for non-Hispanic white, non-Hispanic black, and non-Hispanic Asian adults.
- In 2013 and 2014, Hispanic adults aged 18–64 were the least likely to have seen or talked to a health care professional in the past 12 months.
- In 2013 and 2014, non-Hispanic white adults aged 18–64 were the most likely to have seen or talked to a health care professional in the past 12 months, followed by non-Hispanic black adults and then non-Hispanic Asian adults.
Figure 3. Percentage of adults aged 18–64 that had seen or talked to a health care professional in the past 12 months, by race and Hispanic origin: United States, 2013 and 2014
1Significant difference between 2013 and 2014.
2Significantly different from the other three race and Hispanic origin groups in 2013.
3Significantly different from the other three race and Hispanic origin groups in 2014.
SOURCE: CDC/NCHS, National Health Interview Survey, 2013 and 2014.
Did the percentage of adults who did not obtain needed medical care due to cost change from 2013 to 2014 for selected race and Hispanic origin subgroups?
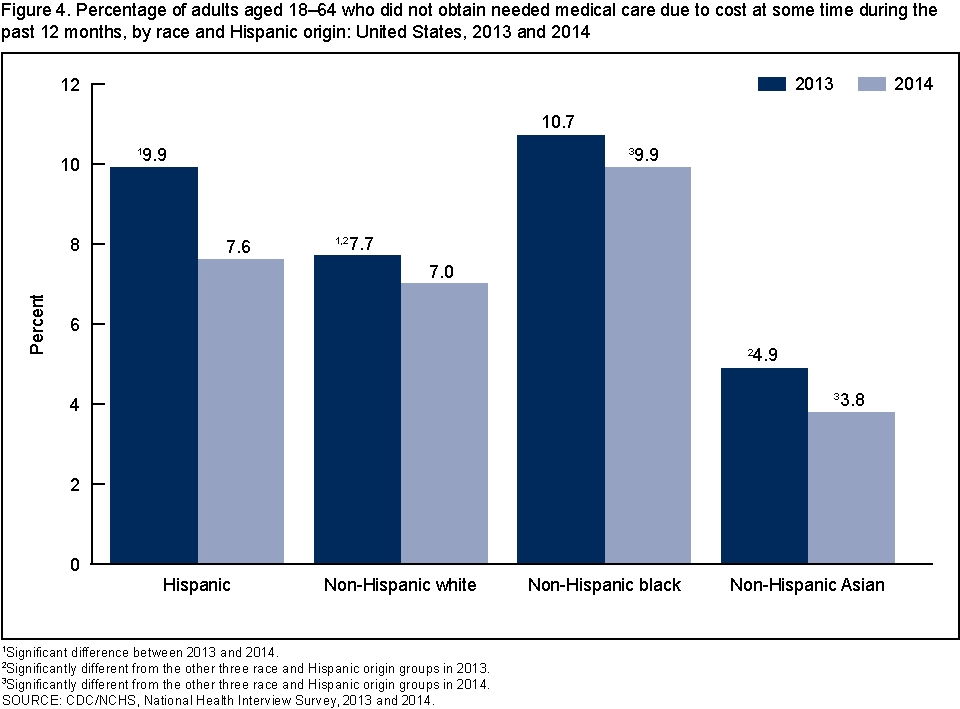
- Compared with 2013, the percentage of adults aged 18–64 who did not obtain needed medical care due to cost at some time during the past 12 months decreased in 2014 for Hispanic (9.9% to 7.6%) and non-Hispanic white (7.7% to 7.0%) adults (Figure 4).
- The percentage of adults aged 18–64 who did not obtain needed medical care due to cost at some time during the past 12 months did not change significantly between 2013 and 2014 for non-Hispanic black and non-Hispanic Asian adults.
- In 2013, Hispanic and non-Hispanic black adults aged 18–64 were the most likely to not obtain needed medical care due to cost at some time during the past 12 months.
- In 2014, non-Hispanic black adults aged 18–64 were the most likely to not obtain needed medical care due to cost at some time during the past 12 months.
- In 2013 and 2014, non-Hispanic Asian adults aged 18–64 were the least likely to not obtain needed medical care due to cost at some time during the past 12 months.
Figure 4. Percentage of adults aged 18–64 who did not obtain needed medical care due to cost at some time during the past 12 months, by race and Hispanic origin: United States, 2013 and 2014
1Significant difference between 2013 and 2014.
2Significantly different from the other three race and Hispanic origin groups in 2013.
3Significantly different from the other three race and Hispanic origin groups in 2014.
SOURCE: CDC/NCHS, National Health Interview Survey, 2013 and 2014.
Summary
For all racial and Hispanic origin subgroups examined, there were significant decreases in the percentage uninsured in 2014. Insurance can lead to improvements in health care access and utilization. Indeed, some improvement was observed for some measures of health care access and utilization, especially for Hispanic and non-Hispanic white adults aged 18–64. Relative to 2013, Hispanic adults in 2014 were significantly more likely to have a usual place for medical care, were more likely to have seen or talked to a health care professional within the past 12 months, and were less likely to have not obtained needed medical care due to cost at some time during the past 12 months. Relative to 2013, non-Hispanic white adults in 2014 were significantly more likely to have a usual place for medical care and were less likely to have not obtained needed medical care due to cost at some time during the past 12 months. However, compared with 2013, non-Hispanic black and non-Hispanic Asian adults in 2014 did not show any significant improvement across the selected measures beyond the decline in the percentage uninsured.
In 2014, Hispanic adults aged 18–64 were still more likely than non-Hispanic adults to have difficulty accessing and using health care, based on the measures used in this study. Poorer health care access and utilization can lead to poorer health outcomes and higher disease prevalence, which have sometimes been observed for Hispanic adults relative to non-Hispanic white adults (1–3).
Definitions
Uninsured: A person was categorized as uninsured if he or she did not have any private health insurance, Medicare, Medicaid, Children’s Health Insurance Program, state-sponsored or other government-sponsored health plan, or military plan at the time of interview. A person was also categorized as uninsured if he or she had only Indian Health Service coverage or had only a private plan that paid for one type of service, such as accidents or dental care. The analyses excluded persons with unknown health insurance status (about 1% of respondents each year).
Usual place to go for medical care: Based on a question that asked, “Is there a place that you usually go to when you are sick or need advice about your health?” If there was at least one such place, then a follow-up question was asked, “What kind of place [is it/do you go to most often]—a clinic, doctor’s office, emergency room, or some other place?” Adults who indicated that the emergency room was their usual place for care were considered not to have a usual place for health care.
Seen or talked to a health care professional in the past 12 months: Based on combined responses of “6 months or less” and “more than 6 months, but not more than 1 year ago” to the survey question, “About how long has it been since you last saw or talked to a doctor or other health care professional about your own health? Include doctors seen while a patient in a hospital.”
Did not obtain needed medical care due to cost in the past 12 months: Based on a question that asked, “During the past 12 months, was there any time when [person] needed medical care, but did not get it because [person] couldn’t afford it?” Responses exclude dental care.
Data source and methods
Data from the 2013 and 2014 NHIS were used for this analysis. NHIS is a multipurpose health survey conducted continuously throughout the year by the Centers for Disease Control and Prevention’s (CDC) National Center for Health Statistics (NCHS). Interviews are conducted in person in respondents’ homes, but follow-ups to complete interviews may be conducted over the telephone. Questions about health insurance coverage and not obtaining needed medical care are from the survey’s Family Core component, while questions about a usual place to go for medical care and having seen or talked to a health care professional in the past 12 months are from the Sample Adult component. The Family Core component collects information on all family members, and the Sample Adult component collects additional data from one randomly selected adult (the sample adult). For more information about NHIS, including the questionnaire, visit the NHIS website.
All analyses used weights to produce national estimates. Data weighting procedures are described elsewhere ( 4). Point estimates and their estimated variances were calculated using SUDAAN software ( 5) and the Taylor series linearization method to account for the complex design of NHIS. Two-sided significance tests at the 0.05 level were used to compare estimates. All estimates shown in this report meet the NCHS standard of reliability (relative standard error less than or equal to 30%).
About the authors
Michael E. Martinez, Brian W. Ward, and Patricia F. Adams are with CDC’s National Center for Health Statistics, Division of Health Interview Statistics.
References
- Ward BW, Clarke TC, Freeman G, Schiller JS. Early release of selected estimates based on data from the 2014 National Health Interview Survey. National Center for Health Statistics. June 2015.
- Cohen RA, Martinez ME. Health insurance coverage: Early release of estimates from the National Health Interview Survey, 2014. National Center for Health Statistics. June 2015.
- Dominguez K, Penman-Aguilar A, Chang MH, Moonesinghe R, Castellanos T, Rodriguez-Lainz A, Schieber R. Vital signs: Leading causes of death, prevalence of diseases and risk factors, and use of health services among Hispanics in the United States—2009–2013. MMWR 64(17):469–478. 2015.
- Parsons VL, Moriarity C, Jonas K, et al. Design and estimation for the National Health Interview Survey, 2006–2015. National Center for Health Statistics. Vital Health Stat 2(165). 2014.
-
RTI International. SUDAAN (Release 11.0.0) [computer software]. 2012.
Suggested citation
Martinez ME, Ward BW, Adams PF. Health care access and utilization among adults aged 18–64, by race and Hispanic origin: United States, 2013 and 2014. NCHS data brief, no 208. Hyattsville, MD: National Center for Health Statistics. 2015.
Copyright information
All material appearing in this report is in the public domain and may be reproduced or copied without permission; citation as to source, however, is appreciated.
National Center for Health Statistics
Charles J. Rothwell, M.S., M.B.A., Director
Nathaniel Schenker, Ph.D., Deputy Director
Jennifer H. Madans, Ph.D., Associate Director for Science
Division of Health Interview Statistics
Marcie L. Cynamon, Director
- Page last reviewed: November 6, 2015
- Page last updated: July 15, 2015
- Content source: