

Prescription Opioid Analgesic Use Among Adults: United States, 1999–2012
 ShareCompartir
NCHS Data Brief No. 189, February 2015
On This Page
- Key findings
- During 2011–2012, what percentage of adults used a prescription opioid analgesic? Has the percentage changed since 1999–2002?
- Among adults who used a prescription opioid analgesic during 2011–2012, what percentages used opioids weaker than, equivalent to, or stronger than morphine? Have these rates changed since 1999–2002?
- Did prescription opioid analgesic use vary by population subgroup?
- Did use of prescription opioid analgesics vary by age among men and women?
- Did use of prescription opioid analgesics vary by race and Hispanic origin among men and women?
- Summary
- Definitions
- Data source and methods
- About the authors
- References
- Suggested citation
PDF Version (334 KB)
Steven M. Frenk, Ph.D.; Kathryn S. Porter, M.D., M.S.; and Leonard J. Paulozzi, M.D., M.P.H.
Key findings
Data from the National Health and Nutrition Examination Survey
- From 1999–2002 to 2003–2006, the percentage of adults aged 20 and over who used a prescription opioid analgesic in the past 30 days increased from 5.0% to 6.9%. From 2003–2006 to 2011–2012, the percentage who used an opioid analgesic remained stable at 6.9%.
- From 1999–2002 to 2011–2012, the percentage of opioid analgesic users who used an opioid analgesic stronger than morphine increased from 17.0% to 37.0%.
- During 2007–2012, the use of opioid analgesics was higher among women (7.2%) than men (6.3%).
- During 2007–2012, the use of opioid analgesics was higher among non-Hispanic white adults (7.5%) compared with Hispanic adults (4.9%). There was no significant difference in use between non-Hispanic white adults and non-Hispanic black adults (6.5%).
Prescription opioid analgesics are used to treat pain from surgery, injury, and health conditions such as cancer. Opioid dependence and opioid-related deaths are growing public health problems. Opioid analgesic sales (in kilograms per 10,000) quadrupled from 1999 to 2010 (1), and from 1999 to 2012, opioid-related deaths (per 100,000) more than tripled (2). During 1999–2002, 4.2% of persons aged 18 and over used a prescription opioid analgesic in the past 30 days (3). This report provides updated estimates and trends in prescription opioid analgesic use among adults aged 20 and over, overall and by selected subgroups.
Keywords: pain, medication, National Health and Nutrition Examination Survey (NHANES)
During 2011–2012, what percentage of adults used a prescription opioid analgesic? Has the percentage changed since 1999–2002?
In 2011–2012, 6.9% of adults aged 20 and over reported using a prescription opioid analgesic in the past 30 days (Figure 1). A significant increase in the use of opioid analgesics was observed between 1999–2002 and 2003–2006, from 5.0% to 6.9%. Since 2003–2006, the percentage of adults using opioid analgesics has remained stable.
Figure 1. Trend in prescription opioid analgesic use in the past 30 days among adults aged 20 and over: United States, 1999–2012
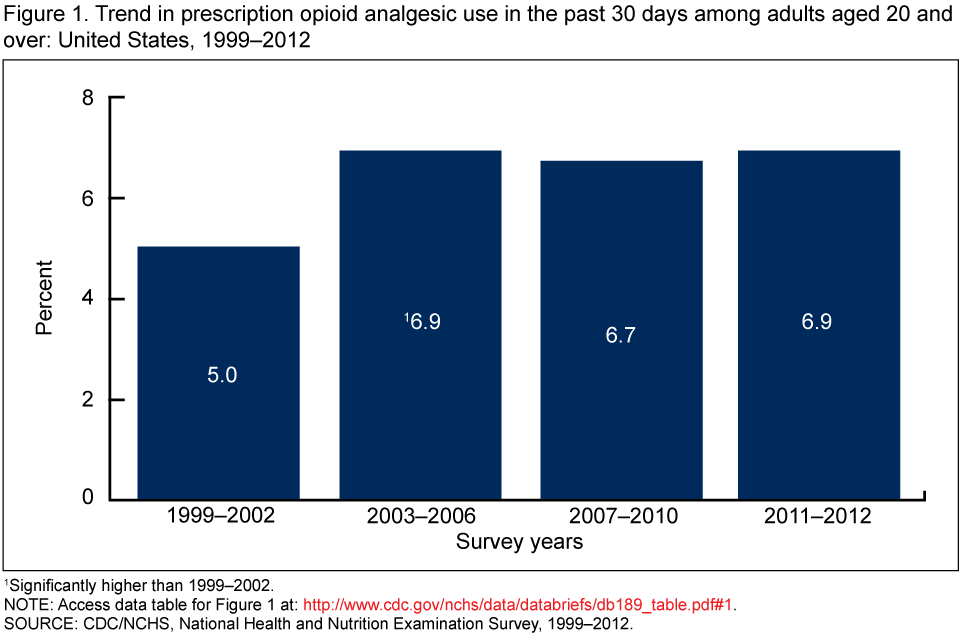
1Significantly higher than 1999–2002.
NOTE: Access data table for Figure 1 [PDF - 132 KB].
SOURCE: CDC/NCHS, National Health and Nutrition Examination Survey, 1999–2012.
Among adults who used a prescription opioid analgesic during 2011–2012, what percentages used opioids weaker than, equivalent to, or stronger than morphine? Have these rates changed since 1999–2002?
In 2011–2012, 37.0% of opioid users used an opioid stronger than morphine in the past 30 days; 20.0% of opioid users used only a weaker-than-morphine opioid. For 43.0% of opioid users, the strongest opioid used was a morphine-equivalent strength opioid (Figure 2).
The percentage who used only a weaker-than-morphine opioid in the past 30 days declined from 42.4% in 1999–2002 to 20.0% in 2011–2012, while the percentage who used a stronger-than-morphine opioid significantly increased from 17.0% in 1999–2002 to 37.0% in 2011–2012.
Figure 2. Trends in the use of different strength opioid analgesics among adults aged 20 and over who used opioids in the past 30 days: United States, 1999–2012
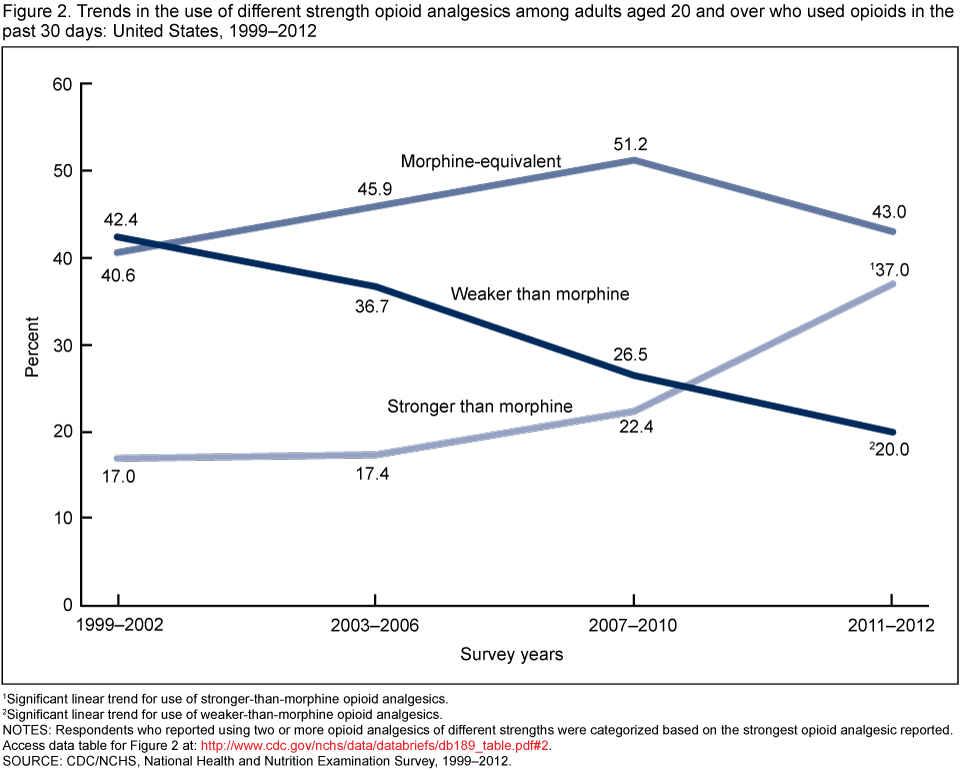
1Significant linear trend for use of stronger-than-morphine opioid analgesics.
2Significant linear trend for use of weaker-than-morphine opioid analgesics.
NOTES: Respondents who reported using two or more opioid analgesics of different strengths were categorized based on the strongest opioid analgesic reported. Access data table for Figure 2 [PDF - 132 KB].
SOURCE: CDC/NCHS, National Health and Nutrition Examination Survey, 1999–2012.
Did prescription opioid analgesic use vary by population subgroup?
The rate of opioid analgesic use was higher among older adults (8.1% for those aged 40–59; 7.9% for those aged 60 and over) than among younger adults (4.7% for those aged 20–39) (Figure 3). The use of opioid analgesics was higher among women (7.2%) than men (6.3%). No significant difference in use was observed between non-Hispanic white (7.5%) and non-Hispanic black adults (6.5%). However, use of opioid analgesics was lower among Hispanic adults (4.9%) compared with non-Hispanic white and non-Hispanic black adults.
Figure 3. Prescription opioid analgesic use in the past 30 days among adults aged 20 and over, by age, sex, and race and Hispanic origin: United States, 2007–2012
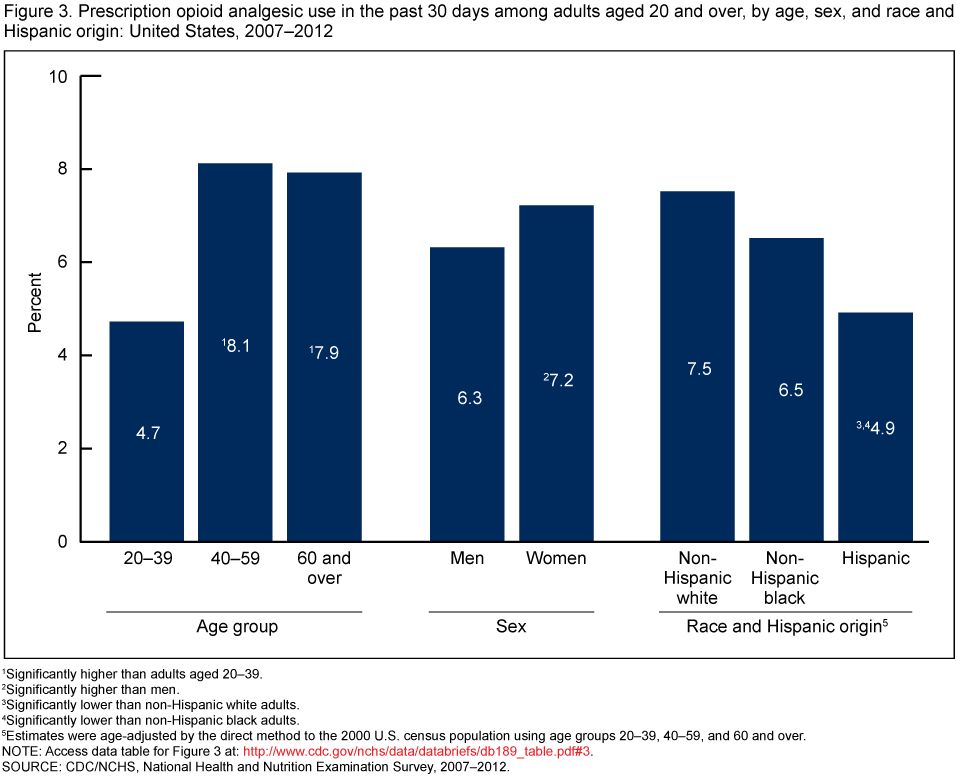
1Significantly higher than adults aged 20–39.
2Significantly higher than men.
3Significantly lower than non-Hispanic white adults.
4Significantly lower than non-Hispanic black adults.
5Estimates were age-adjusted by the direct method to the 2000 U.S. census population using age groups 20–39, 40–59, and 60 and over.
NOTE: Access data table for Figure 3 [PDF- 132 KB].
SOURCE: CDC/NCHS, National Health and Nutrition Examination Survey, 2007–2012.
Did use of prescription opioid analgesics vary by age among men and women?
Men aged 20–39 were less likely to use opioid analgesics (4.2%) compared with men aged 40–59 (8.1%) or 60 and over (6.9%) (Figure 4). Women aged 20–39 also were less likely (5.2%) than those aged 40–59 (8.0%) or 60 and over (8.6%) to use opioid analgesics. Women aged 60 and over were more likely to use opioids (8.6%) than men aged 60 and over (6.9%). For the other age groups, no significant differences in the use of opioids were observed between men and women.
Figure 4. Prescription opioid analgesic use in the past 30 days among adults aged 20 and over, by sex and age: United States, 2007–2012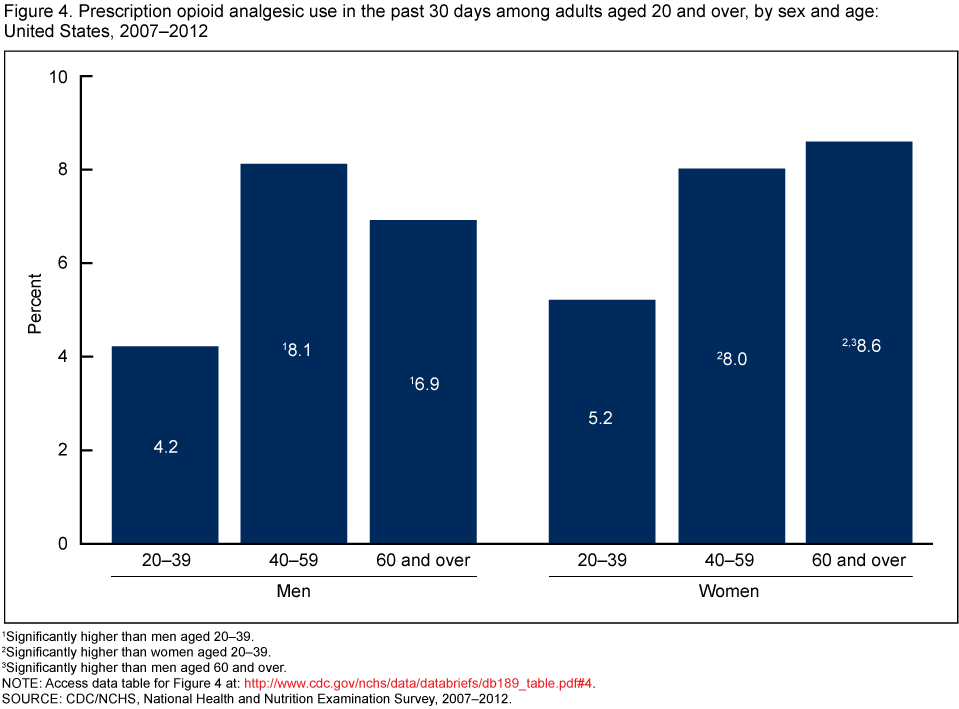 1Significantly higher than men aged 20–39.
2Significantly higher than women aged 20–39.
3Significantly higher than men aged 60 and over.
NOTE: Access data table for Figure 4 [PDF - 132 KB].
SOURCE: CDC/NCHS, National Health and Nutrition Examination Survey, 2007–2012.
Did use of prescription opioid analgesics vary by race and Hispanic origin among men and women?
Non-Hispanic white men were more likely to use opioid analgesics (7.3%) than non-Hispanic black (5.7%) and Hispanic men (4.1%) (Figure 5). Non-Hispanic black men were more likely to use opioid analgesics than Hispanic men. Non-Hispanic white women were more likely to use opioid analgesics (7.8%) than Hispanic women (5.7%). No significant difference in the use of opioid analgesics was observed between non-Hispanic white (7.8%) and non-Hispanic black women (7.1%). Hispanic women were more likely to use opioid analgesics (5.7%) than Hispanic men (4.1%). For the other race and Hispanic origin groups, no significant differences were observed between men and women.
Figure 5. Prescription opioid analgesic use in the past 30 days among adults aged 20 and over, by sex and race and Hispanic origin: United States, 2007–2012
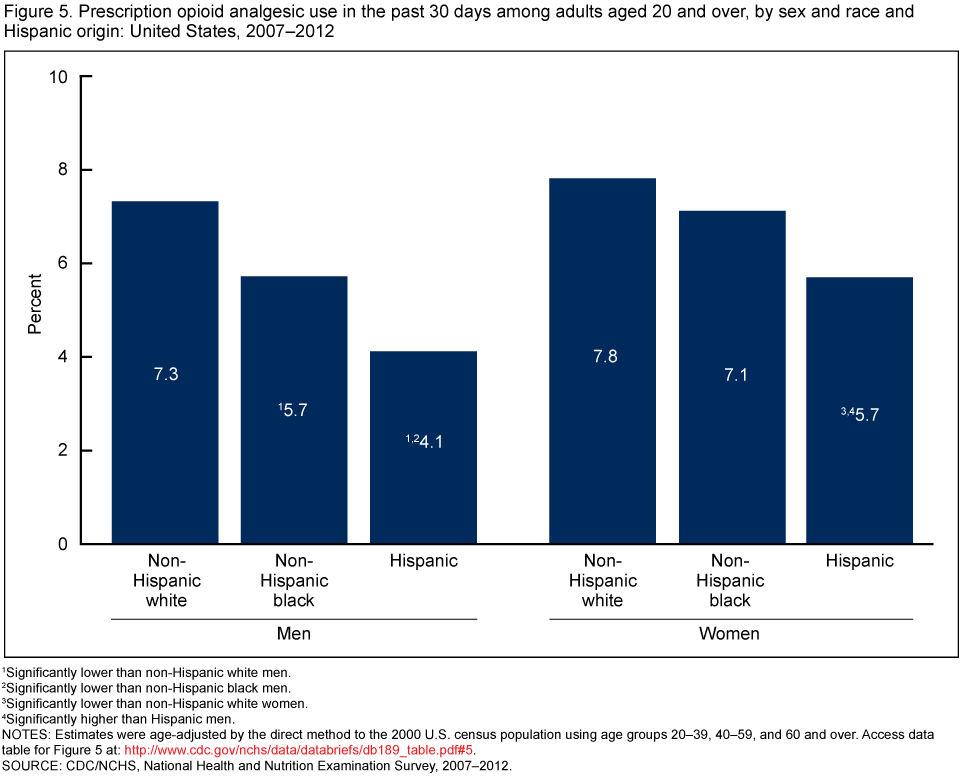
1Significantly lower than non-Hispanic white men.
2Significantly lower than non-Hispanic black men.
3Significantly lower than non-Hispanic white women.
4Significantly higher than Hispanic men.
NOTES: Estimates were age-adjusted by the direct method to the 2000 U.S. census population using age groups 20–39, 40–59, and 60 and over. Access data table for Figure 5 [PDF - 132 KB].
SOURCE: CDC/NCHS, National Health and Nutrition Examination Survey, 2007–2012.
Summary
The percentage of adults aged 20 and over who used a prescription opioid analgesic in the past 30 days significantly increased from 5.0% in 1999–2002 to 6.9% in 2003–2006, and then remained stable through 2011–2012 (6.9%). Together with findings from the third National Health and Nutrition Examination Survey (1988–1994), these findings indicate that the use of opioid analgesics among U.S. adults has more than doubled since 1988–1994, when 3.4% used opioid analgesics (4).
Among adults who used opioids during 1999–2012, the percentage of adults who used only a weaker-than-morphine opioid analgesic declined from 42.4% to 20.0%, while the percentage of adults who used a stronger-than-morphine opioid increased from 17.0% to 37.0%.
Use of opioid analgesics varied significantly among population subgroups. Older adults (aged 40–59 and 60 and over) were more likely to use opioid analgesics than adults aged 20–39. Women were more likely to use opioid analgesics than men, and non-Hispanic white adults were more likely to use opioid analgesics than Hispanic adults. There was no significant difference in the use of opioid analgesics between non-Hispanic white and non-Hispanic black adults. Women aged 60 and over were more likely to use opioid analgesics than men aged 60 and over.
Definitions
Prescription medication use: Survey participants were asked if they had taken a prescription medication in the past 30 days. Those who answered “yes” were asked to show the interviewer the medication containers of all prescription medications. For each drug reported, the interviewer recorded the product’s complete name from the container (5). Prescription medications were classified based on the therapeutic classification scheme of Cerner Multum’s Lexicon (6). Information on dosage was not collected. Information on whether the medication had been prescribed to the respondent was not collected. Respondents were not asked whether they used the medication for the prescribed use or for nonmedical reasons.
Opioid analgesics: Opioid analgesics were identified using the Multum ingredient category codes 60 (narcotic analgesics) and 191 (narcotic analgesic combinations). Two drugs, buprenorphine (primarily used to treat opioid addiction) and opium (typically not prescribed for pain), were excluded. These categories included a small number of opioid drugs typically used for cough and colds rather than pain. These drugs accounted for about 4% of all opioids reported. Nine opioid analgesics with the ingredient category code 59 (miscellaneous analgesics) were also included.
Opioid strength: Prescription opioid analgesics were categorized based on their strength relative to morphine (7). Respondents who reported using two or more opioid analgesics of different strengths were categorized based on the strongest opioid analgesic they used. About 11% of respondents reported using two or more opioid analgesics in the past 30 days.
Weaker-than-morphine opioid analgesics: Includes codeine, dihydrocodeine, meperidine, pentazocine, propoxyphene, and tramadol.
Morphine-equivalent opioid analgesics: Includes hydrocodone, morphine, and tapentadol.
Stronger-than-morphine opioid analgesics: Includes fentanyl, hydromorphone, methadone, oxycodone, and oxymorphone.
Data source and methods
NHANES is a cross-sectional survey designed to monitor the health and nutritional status of the civilian noninstitutionalized U.S. population (8). It is conducted by the Centers for Disease Control and Prevention’s (CDC) National Center for Health Statistics (NCHS). Data from NHANES 1999–2002 through 2011–2012 were used for trend analysis. The three most recent cycles (2007–2008, 2009–2010, and 2011–2012) were used to examine the use of opioid analgesics among population subgroups.
A complex, multistage probability sampling design was used to generate a representative sample of the civilian noninstitutionalized U.S. population (9).
Interview sample weights, accounting for the differential probabilities of selection, nonresponse, and noncoverage, were used for analyses. Variance estimates accounted for the complex survey design using Taylor series linearization. Estimates for the race and Hispanic origin subpopulations were age-adjusted by the direct method to the 2000 U.S. census population, using age groups 20–39, 40–59, and 60 and over (10). Orthogonal contrast matrices generated using the Stata command “_contrast_” (adjusted for the uneven midpoints of the time periods used in the analysis [three 4-year periods and one 2-year period]) were used to test for the presence of linear trends. For all tests, a significance level of 0.05 was used. All differences reported are statistically significant unless otherwise indicated. Statistical analyses were conducted using the SVY commands in Stata 12.1 (11).
About the authors
Steven M. Frenk and Kathryn S. Porter are with CDC’s National Center for Health Statistics, Division of Health and Nutrition Examination Surveys. Leonard J. Paulozzi is with CDC’s National Center for Injury Prevention and Control, Division of Unintentional Injury Prevention.
References
- CDC. Vital signs: Overdoses of prescription opioid pain relievers—United States, 1999–2008. MMWR 60(43):1487–92. 2011.
- Warner M, Hedegaard H, Chen LH. Trends in drug-poisoning deaths involving opioid analgesics and heroin: United States, 1999–2012 [PDF - 184KB]. NCHS health e-stats. 2014.
- NCHS. Health, United States, 2006: With chartbook on trends in the health of Americans. Hyattsville, MD: 2006.
- Paulose-Ram R, Hirsch R, Dillon C, Losonczy K, Cooper M, Ostchega Y. Prescription and non-prescription analgesic use among the U.S. adult population: Results from the third National Health and Nutrition Examination Survey (NHANES III). Pharmacoepidemiol Drug Saf 12(4):315–26. 2003.
- NCHS. National Health and Nutrition Examination Survey, 2011–2012 data documentation, codebook, and frequencies: Prescription medications. 2014.
- NCHS. National Health and Nutrition Examination Survey, 1988–2010 data documentation, codebook, and frequencies: Prescription medications—drug information. 2012.
- Von Korff M, Saunders K, Thomas Ray G, Boudreau D, Campbell C, Merrill J, et al. De facto long-term opioid therapy for noncancer pain. Clin J Pain 24(6):521–7. 2008.
- NCHS. About the National Health and Nutrition Examination Survey.
- Curtin LR, Mohadjer LK, Dohrmann SM, et al. National Health and Nutrition Examination Survey: Sample design, 2007–2010. National Center for Health Statistics. Vital Health Stat 2(160). 2013.
- Klein RJ, Schoenborn CA. Age adjustment using the 2000 projected U.S. population. Healthy People Statistical Notes, no. 20. Hyattsville, MD: National Center for Health Statistics. 2001.
- StataCorp. Stata Statistical Software (Release 12) [computer software]. 2011.
Suggested citation
Frenk SM, Porter KS, Paulozzi LJ. Prescription opioid analgesic use among adults: United States, 1999–2012. NCHS data brief, no 189. Hyattsville, MD: National Center for Health Statistics. 2015.
Copyright information
All material appearing in this report is in the public domain and may be reproduced or copied without permission; citation as to source, however, is appreciated.
National Center for Health Statistics
Charles J. Rothwell, M.S., M.B.A., Director
Nathaniel Schenker, Ph.D., Deputy Director
Jennifer H. Madans, Ph.D., Associate Director for Science
Division of Health and Nutrition Examination Surveys
Kathryn S. Porter, M.D., M.S., Director
- Page last reviewed: February 25, 2015
- Page last updated: February 25, 2015
- Content source: