

Prevalence of Reduced Muscle Strength in Older U.S. Adults: United States, 2011–2012
 ShareCompartir
NCHS Data Brief No. 179, January 2015
On This Page
- Key findings
- What was the muscle strength status of older U.S. adults overall and by age in 2011–2012?
- Did the prevalence of reduced muscle strength differ by sex among older adults in 2011–2012?
- Did the prevalence of reduced muscle strength differ by race and Hispanic origin among older adults in 2011–2012?
- Did the prevalence of older adults who had difficulty rising from an armless chair differ by muscle strength status in 2011–2012?
- Summary
- Definitions
- Data source and methods
- About the authors
- References
- Suggested citation
PDF Version (563 KB)
Anne C. Looker, Ph.D.; and Chia-Yih Wang, Ph.D.
Key findings
Data from the National Health and Nutrition Examination Survey, 2011–2012
- Five percent of adults aged 60 and over had weak muscle strength. Thirteen percent had intermediate muscle strength, while 82% had normal muscle strength.
- The prevalence of reduced (weak and intermediate) muscle strength increased with age, while the prevalence of normal strength decreased with age.
- Muscle strength status did not differ by sex, except among persons aged 80 and over, where women had a higher prevalence of weak muscle strength than men.
- Non-Hispanic Asian and Hispanic persons had a higher prevalence of reduced muscle strength than non-Hispanic white persons.
- Difficulty with rising from a chair increased as strength status decreased.
Muscle weakness is linked to impaired mobility and mortality in older persons (1,2). The Foundation for the National Institutes of Health (FNIH) Sarcopenia Project recently developed sex-specific criteria to diagnose different degrees of muscle strength (i.e., weak, intermediate, and normal) in older adults based on maximum hand grip strength (1,3). These thresholds are related to the level of muscle weakness that is associated with slow gait speed, an important mobility impairment (3). This report uses the FNIH criteria to provide national estimates of muscle strength in older adults in the United States in 2011–2012.
Keywords: grip strength, National Health and Nutrition Examination Survey (NHANES)
What was the muscle strength status of older U.S. adults overall and by age in 2011–2012?
In 2011–2012, 5% of persons aged 60 and over had weak muscle strength, 13% had intermediate strength, and 82% had normal strength, according to the FNIH criteria (Figure 1). Reduced (weak and intermediate) strength increased with age, while normal strength decreased with age. Among persons aged 60–79, 2% had weak strength, 8% had intermediate strength, and 90% had normal strength. In contrast, among those aged 80 and over, 19% had weak strength, 34% had intermediate strength, and 47% had normal strength.
Figure 1. Muscle strength status in adults aged 60 and over, by age: United States, 2011–2012
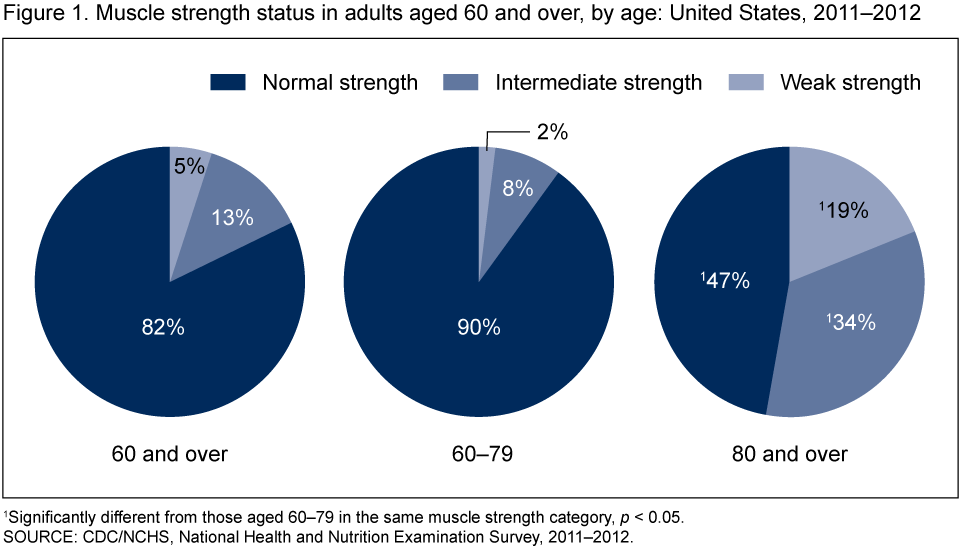
1Significantly different from those aged 60–79 in the same muscle strength category, p < 0.05.
SOURCE: CDC/NCHS, National Health and Nutrition Examination Survey, 2011–2012.
Did the prevalence of reduced muscle strength differ by sex among older adults in 2011–2012?
Reduced muscle strength status, based on sex-specific criteria, did not differ by sex overall or when compared within age groups, with one exception: The prevalence of weak strength was higher in women aged 80 and over when compared with men of the same age (Figure 2).
Figure 2. Percentage with reduced muscle strength among adults aged 60 and over, by sex and age: United States, 2011–2012
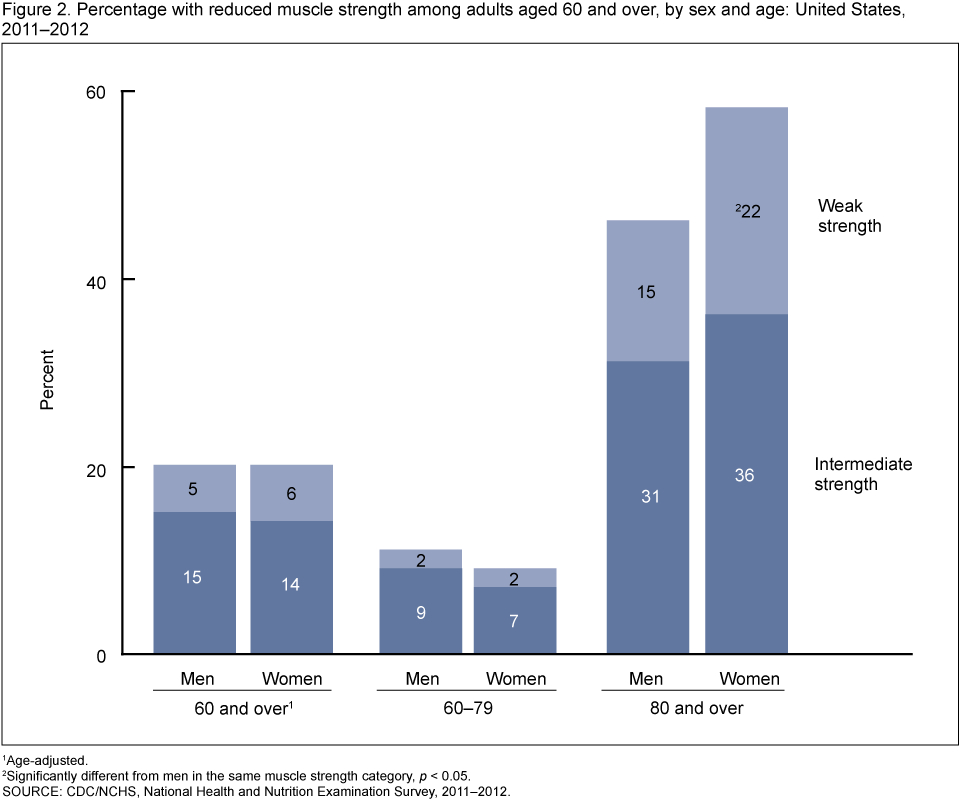
1Age-adjusted.
2Significantly different from men in the same muscle strength category, p < 0.05.
SOURCE: CDC/NCHS, National Health and Nutrition Examination Survey, 2011–2012.
Did the prevalence of reduced muscle strength differ by race and Hispanic origin among older adults in 2011–2012?
The prevalence of reduced muscle strength differed by race and Hispanic origin after adjusting for age differences (Figure 3). The age-adjusted prevalence of weak strength (15%) and intermediate strength (25%) in non-Hispanic Asian persons was higher than the prevalence of these conditions in non-Hispanic white persons (5% with weak strength; 13% with intermediate strength) or non-Hispanic black persons (6% with weak strength; 13% with intermediate strength). The age-adjusted prevalence of weak strength (9%) and intermediate strength (23%) in Hispanic persons was also higher than the prevalence of these conditions in non-Hispanic white persons. In addition, the age-adjusted prevalence of Hispanic persons with intermediate strength was higher than the prevalence in non-Hispanic black persons. Neither condition differed between non-Hispanic Asian and Hispanic persons.
Figure 3. Age-adjusted percentage with reduced muscle strength in adults aged 60 and over, by race and Hispanic origin: United States, 2011–2012
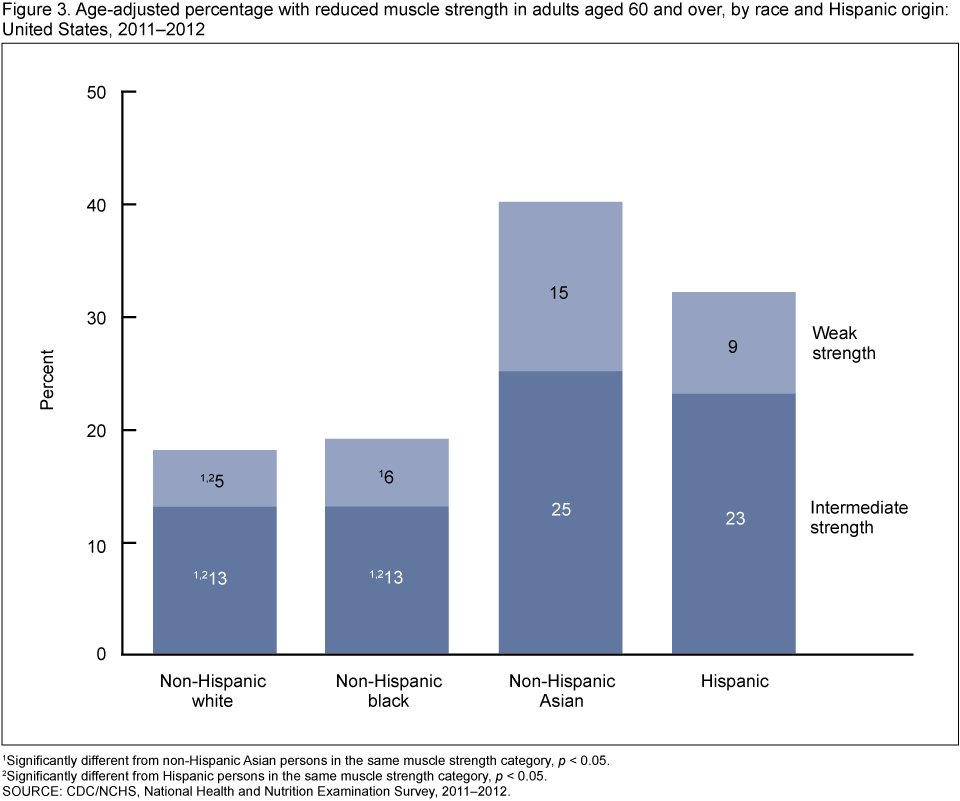
1Significantly different from non-Hispanic Asian persons in the same muscle strength category, p < 0.05.
2Significantly different from Hispanic persons in the same muscle strength category, p < 0.05.
SOURCE: CDC/NCHS, National Health and Nutrition Examination Survey, 2011–2012.
Did the prevalence of older adults who had difficulty rising from an armless chair differ by muscle strength status in 2011–2012?
The prevalence of adults aged 60 and over who reported difficulty in rising from an armless chair differed by muscle strength status (Figure 4). The percentage reporting difficulty rising from an armless chair increased with decreasing strength. Fifty-five percent of those with weak strength reported difficulty rising from an armless chair, compared with 26% of those with intermediate strength, and 13% of those with normal strength.
Figure 4. Percentage of adults aged 60 and over with difficulty rising from a chair, by muscle strength: United States, 2011–2012
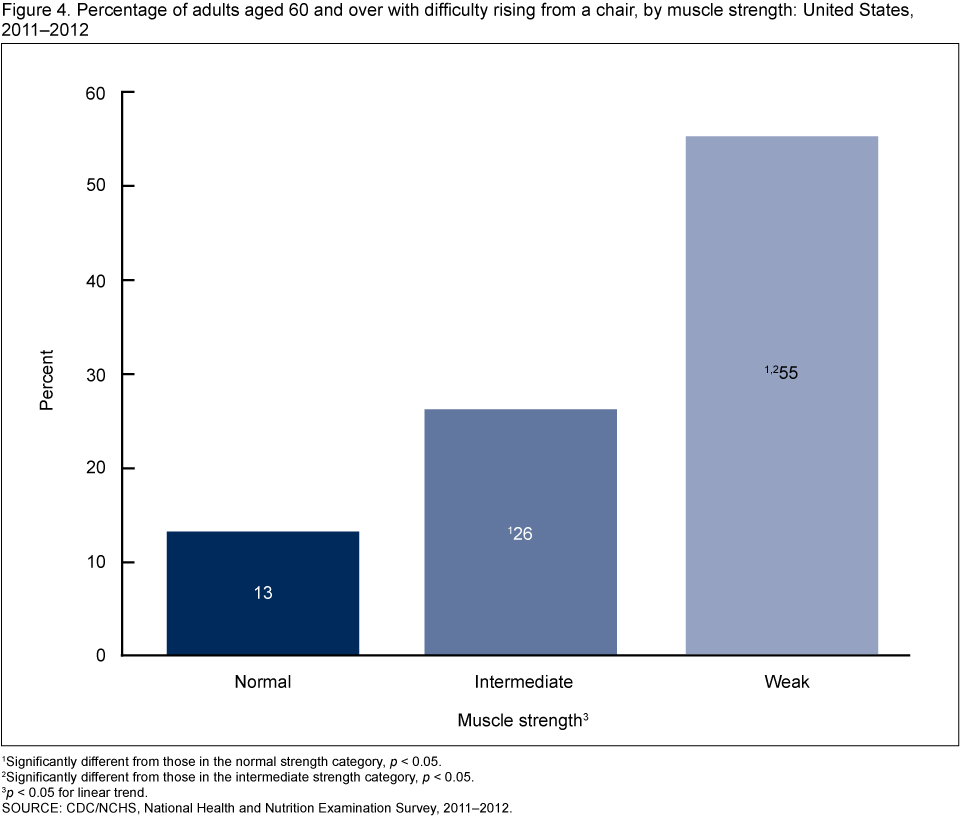
1Significantly different from those in the normal strength category, p < 0.05.
2Significantly different from those in the intermediate strength category, p < 0.05.
3p < 0.05 for linear trend.
SOURCE: CDC/NCHS, National Health and Nutrition Examination Survey, 2011–2012.
Summary
Five percent of adults aged 60 and over had weak muscle strength and 13% had intermediate muscle strength, as defined by the new FNIH criteria (1). Weak muscle strength is clinically relevant because it is associated with slow gait speed, an important mobility impairment (1,2). It is also linked to an increased risk of death (2). The prevalence of reduced muscle strength increased with age and was higher in non-Hispanic Asian and Hispanic persons than in non-Hispanic white or non-Hispanic black persons. Decreasing muscle strength was linked with increased difficulty in rising from an armless chair, which is another important type of mobility impairment (1).
Definitions
Weak muscle strength: A value for maximum hand grip strength less than 26 kilograms (kg) for men and less than 16 kg for women (1,3).
Intermediate muscle strength: A value for maximum hand grip strength between 26 kg–31.9 kg for men and 16 kg–19.9 kg for women (3).
Normal muscle strength: A value for maximum hand grip strength greater than or equal to 32 kg for men and greater than or equal to 20 kg for women (3).
Difficulty rising from a chair: Self-reported difficulty in rising from an armless straight chair without assistance. Respondents who reported “some difficulty,” “much difficulty,” or “unable to do” were defined as having difficulty.
Data source and methods
National Health and Nutrition Examination Survey (NHANES) data were used for these analyses. NHANES is a cross-sectional survey designed to monitor the health and nutritional status of the civilian noninstitutionalized U.S. population (4). The survey consists of interviews conducted in participants’ homes and standardized physical examinations that include an isometric grip strength test using a Takei Digital Grip Strength Dynamometer (5). The maximum value of any of six grip strength tests (three tests performed on each hand) was used in the present analyses.
The NHANES sample is selected through a complex, multistage design that includes selection of primary sampling units (counties), household segments within the counties, and finally sample persons from selected households. In 2011–2012, non-Hispanic black, non-Hispanic Asian, and Hispanic persons, among other groups, were oversampled to obtain reliable estimates for these population subgroups. Estimates for race and Hispanic origin groups reflect individuals reporting only one race; those reporting more than one race are included in the total, but are not reported separately.
Sample weights, which account for the differential probabilities of selection, nonresponse, and noncoverage, were incorporated into the estimation process. The standard errors of the percentages were estimated using Taylor series linearization, a method that incorporates the sample design. Prevalence estimates were age-adjusted to the 2000 U.S. standard population using the following age groups: 60–69, 70–79, and 80 and over. Differences between groups were evaluated using a t statistic at the p less than 0.05 significance level. Tests of trends were done using the p less than 0.05 significance level. All results presented have a relative standard error of less than 30%. All differences reported are statistically significant unless otherwise noted. Statistical analyses were conducted using the SAS System for Windows, release 9.3 (SAS Institute Inc., Cary, N.C.) and SUDAAN, release 11.0.1 (RTI International, Research Triangle Park, N.C.).
About the authors
Anne C. Looker and Chia-Yih Wang are with CDC’s National Center for Health Statistics, Division of Health and Nutrition Examination Surveys.
References
- Studenski SA, Peters KW, Alley DE, Cawthon PM, McLean RR, Harris TB, et al. The FNIH Sarcopenia Project: Rationale, study description, conference recommendations, and final estimates. J Gerontol A Biol Sci Med Sci 69(5):547–58. 2014.
- McLean RR, Shardell MD, Alley DE, Cawthon PM, Fragala MS, Harris TB, et al. Criteria for clinically relevant weakness and low lean mass and their longitudinal association with incident mobility impairment and mortality: The Foundation for the National Institutes of Health (FNIH) Sarcopenia Project. J Gerontol A Biol Sci Med Sci 69(5):576–83. 2014.
- Alley DE, Shardell MD, Peters KW, McLean RR, Dam TT, Kenny AM, et al. Grip strength cutpoints for the identification of clinically relevant weakness. J Gerontol A Biol Sci Med Sci 69(5):559–66. 2014.
- NCHS. NHANES 2011–2012 overview.
- NCHS. National Health and Nutrition Examination Survey (NHANES) Muscle Strength Procedures Manual. 2011.
Suggested citation
Looker AC, Wang CY. Prevalence of reduced muscle strength in older U.S. adults: United States, 2011–2012. NCHS data brief, no 179. Hyattsville, MD: National Center for Health Statistics. 2015.
Copyright information
All material appearing in this report is in the public domain and may be reproduced or copied without permission; citation as to source, however, is appreciated.
National Center for Health Statistics
Charles J. Rothwell, M.S., M.B.A., Director
Jennifer H. Madans, Ph.D., Associate Director for Science
Division of Health and Nutrition Examination Surveys
Kathryn S. Porter, M.D., M.S., Director
- Page last reviewed: November 6, 2015
- Page last updated: January 28, 2015
- Content source: