

Depression in the U.S. Household Population, 2009-2012
 ShareCompartir
NCHS Data Brief No. 172, December 2014
On This Page
- Key findings
- In 2009–2012, 7.6% of Americans aged 12 and over had depression (moderate or severe depressive symptoms in the past 2 weeks).
- Approximately 3% of all Americans aged 12 and over had severe depressive symptoms, while almost 78% had no depressive symptoms.
- Poor persons were more than twice as likely to have depression as persons living at or above the poverty level.
- Nearly 90% of persons with severe depressive symptoms reported difficulty with work, home, or social activities related to their symptoms.
- Just over one-third (35.3%) of persons with severe depressive symptoms reported having seen a mental health professional in the past year.
- Summary
- Definitions
- Data sources and methods
- About the authors
- References
- Suggested citation
PDF Version (555 KB)
Laura A. Pratt, Ph.D., and Debra J. Brody, M.P.H.
Key findings
Data from the National Health and Nutrition Examination Survey, 2009–2012
- During 2009–2012, 7.6% of Americans aged 12 and over had depression (moderate or severe depressive symptoms in the past 2 weeks). Depression was more prevalent among females and persons aged 40–59.
- About 3% of Americans aged 12 and over had severe depressive symptoms, while almost 78% had no symptoms.
- Persons living below the poverty level were nearly 2½ times more likely to have depression than those at or above the poverty level.
- Almost 43% of persons with severe depressive symptoms reported serious difficulties in work, home, and social activities.
- Of those with severe symptoms, 35% reported having contact with a mental health professional in the past year.
Depression is a serious medical illness with mood, cognitive, and physical symptoms (1). Depression is associated with higher rates of chronic disease, increased health care utilization, and impaired functioning (2,3). Rates of treatment remain low, and the treatment received is often inadequate (1). This data brief examines both depression and depressive symptom severity in the past 2 weeks from a symptom-based questionnaire, by demographic characteristics, functioning difficulties, and recent contact with a mental health professional. Severity is categorized as severe, moderate, mild, or no depressive symptoms. Current depression is defined as severe or moderate symptoms; no depression is defined as mild or no symptoms.
Keywords: NHANES, depressive symptoms, mental health
In 2009–2012, 7.6% of Americans aged 12 and over had depression (moderate or severe depressive symptoms in the past 2 weeks).
Figure 1. Percentage of persons aged 12 and over with depression, by age and sex: United States, 2009–2012
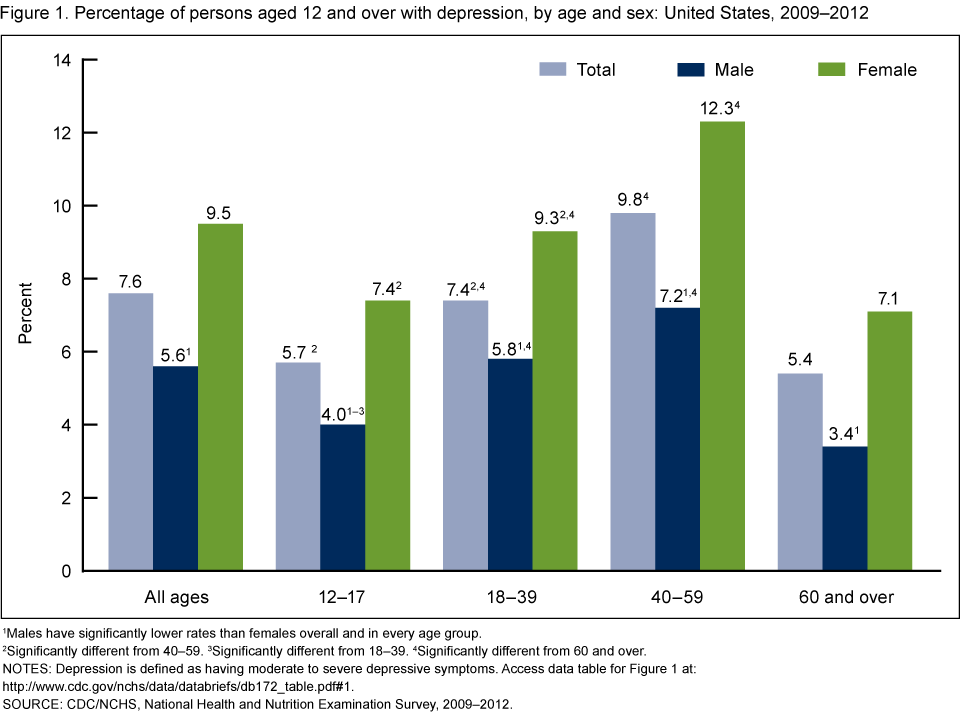
1Males have significantly lower rates than females overall and in every age group.
2Significantly different from 40–59.
3Significantly different from 18–39.
4Significantly different from 60 and over.
NOTES: Depression is defined as having moderate to severe depressive symptoms. Access data table for Figure 1.
SOURCE: CDC/NCHS, National Health and Nutrition Examination Survey, 2009–2012.
- Females had higher rates of depression than males in every age group (Figure 1).
- The rate of depression increased by age, from 5.7% among youth aged 12–17 to 9.8% among adults aged 40–59, but adults aged 60 and over had a significantly lower rate of depression (5.4%) than those aged 18–39 and 40–59.
- The highest rate of depression, 12.3%, was found in women aged 40–59.
- The lowest rates of depression were for males aged 12–17 (4.0%) and 60 and over (3.4%).
Approximately 3% of all Americans aged 12 and over had severe depressive symptoms, while almost 78% had no depressive symptoms.
- Non-Hispanic black persons had a higher rate of severe depressive symptoms (4.1%) than non-Hispanic white persons (2.6%) (Figure 2).
- Non-Hispanic black persons and Hispanic persons had higher rates of mild and moderate depressive symptoms than non-Hispanic white persons. Non-Hispanic white persons were more likely to have no depressive symptoms (78.5%) than either non-Hispanic black persons (73.2%) or Hispanic persons (73.9%).
Figure 2. Percentage of persons aged 12 and over by depressive symptom severity and race and Hispanic origin: United States, 2009–2012
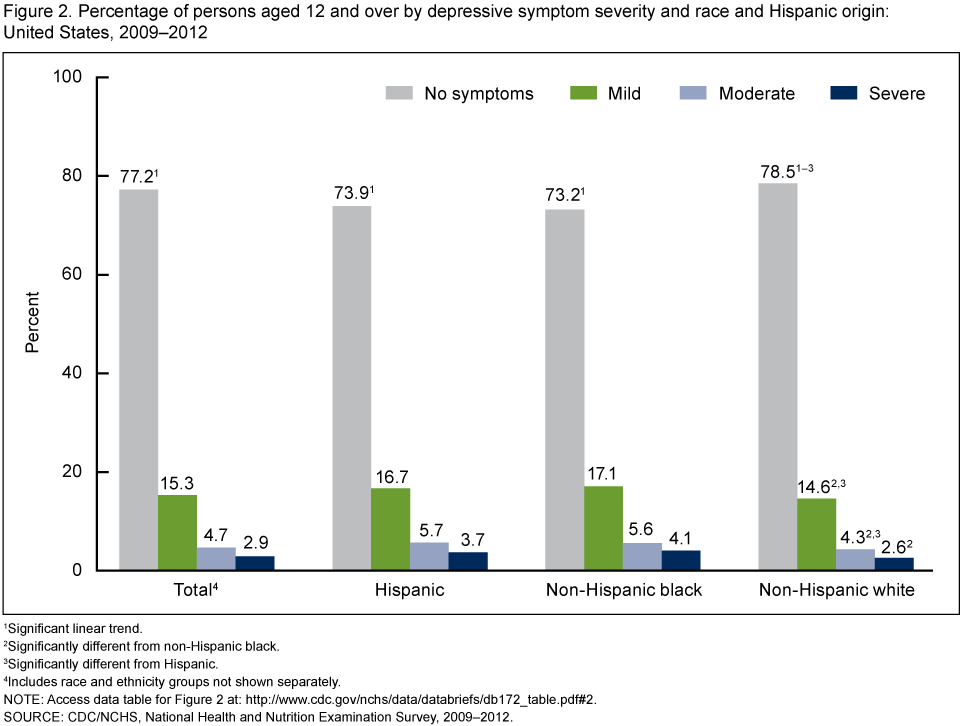
1Significant linear trend.
2Significantly different from non-Hispanic black.
3Significantly different from Hispanic.
4Includes race and ethnicity groups not shown separately.
NOTE: Access data table for Figure 2.
SOURCE: CDC/NCHS, National Health and Nutrition Examination Survey, 2009–2012.
Poor persons were more than twice as likely to have depression as persons living at or above the poverty level.
- More than 15% of persons living below the federal poverty level had depression compared with 6.2% of persons living at or above the poverty level (Figure 3).
- No significant differences were observed in rates of depression by race and Hispanic origin among persons living below the poverty level or among those living at or above the poverty level.
Figure 3. Percentage of persons aged 12 and over with depression, by poverty status and race and Hispanic origin: United States, 2009–2012
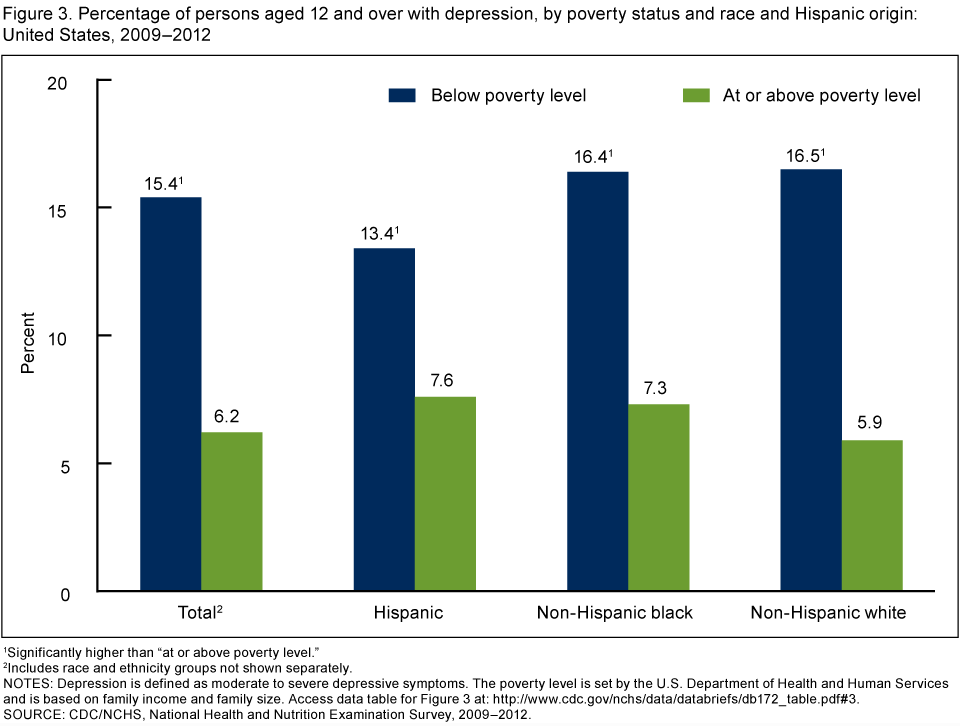
1Significantly higher than “at or above poverty level.”
2Includes race and ethnicity groups not shown separately.
NOTES: Depression is defined as moderate to severe depressive symptoms. The poverty level is set by the U.S. Department of Health and Human Services and is based on family income and family size. Access data table for Figure 3.
SOURCE: CDC/NCHS, National Health and Nutrition Examination Survey, 2009–2012.
Nearly 90% of persons with severe depressive symptoms reported difficulty with work, home, or social activities related to their symptoms.
- Rates of any difficulty with work, home, or social activities related to depressive symptoms increased as the severity of those symptoms increased, from 45.7% among persons with mild depressive symptoms to 88.0% among those with severe depressive symptoms (Figure 4).
- Rates of serious difficulty with work, home, or social activities related to depressive symptoms also increased as symptom severity increased, from 3.9% among persons with mild depressive symptoms to 15.8% among persons with moderate symptoms, and 42.8% among those with severe symptoms.
Figure 4. Percentage of persons aged 12 and over reporting difficulty with work, home, or social activities due to depressive symptoms, by severity: United States, 2009–2012
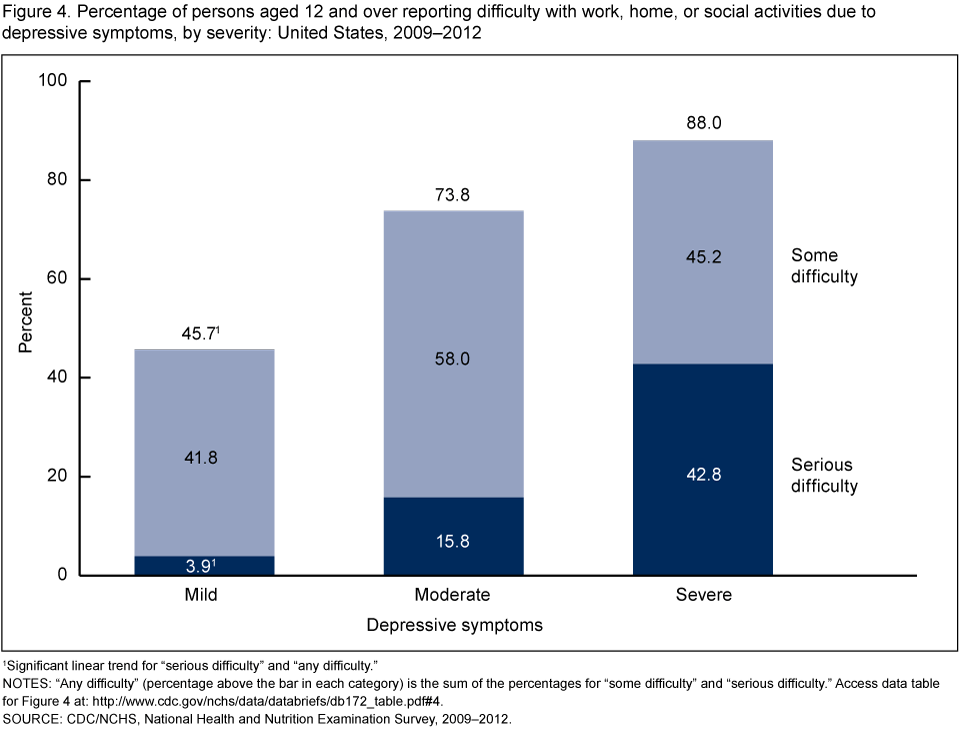
1Significant linear trend for “serious difficulty” and “any difficulty.”
NOTES: “Any difficulty” (percentage above the bar in each category) is the sum of the percentages for “some difficulty” and “serious difficulty.” Access data table for Figure 4.
SOURCE: CDC/NCHS, National Health and Nutrition Examination Survey, 2009–2012.
Just over one-third (35.3%) of persons with severe depressive symptoms reported having seen a mental health professional in the past year.
- Rates of seeing a mental health professional increased as severity of depressive symptoms increased in all race and Hispanic origin groups (Figure 5).
- Less than 20% of all Americans with moderate depressive symptoms reported having seen a mental health professional in the past year. About 5% of persons with no depressive symptoms and 13% of persons with mild symptoms have also seen a mental health professional in the past year.
- Hispanic persons with mild depressive symptoms were less likely to have seen a mental health professional than non-Hispanic black or non-Hispanic white persons with the same level of symptoms.
- Among persons with moderate or severe depressive symptoms, no significant differences were observed in the rate of seeing a mental health professional by race and Hispanic origin.
Figure 5. Percentage of those aged 12 and over who contacted a mental health professional in past 12 months, by depressive symptom severity and race and Hispanic origin: United States, 2009–2012
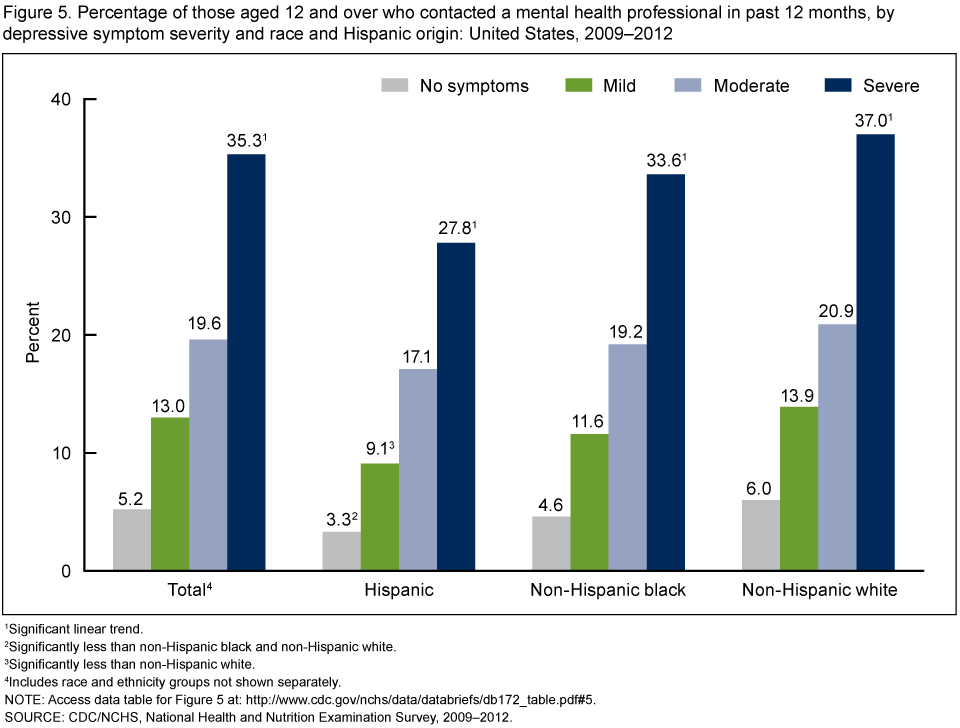
1Significant linear trend.
2Significantly less than non-Hispanic black and non-Hispanic white.
3Significantly less than non-Hispanic white.
4Includes race and ethnicity groups not shown separately.
NOTE: Access data table for Figure 5.
SOURCE: CDC/NCHS, National Health and Nutrition Examination Survey, 2009–2012.
Summary
During 2009–2012, 7.6% of Americans aged 12 and over had depression (defined as having moderate or severe depressive symptoms in the past 2 weeks). Depression was more prevalent among females than males and among adults aged 40–59 than those of other age groups. Rates of any depressive symptoms were lower among non-Hispanic white persons than among Hispanic and non-Hispanic black persons. Once poverty was taken into account, however, rates of depression did not differ significantly by race or Hispanic origin.
Persons with mild depressive symptoms, as well as those with moderate or severe depressive symptoms, reported difficulties with work, home, and social activities related to their symptoms. Numerous studies have also shown that persons with depression have more functional limitations than those without depression (3,5).
Studies have shown that the most effective treatment for depression, especially for severe depression, is a combination of medication and therapy (6–8). Although medication can be prescribed by a primary care physician, therapy is generally provided by a mental health professional. These data demonstrate that among those having severe depressive symptoms, only 35% reported seeing a mental health professional in the past year.
Definitions
Depressive symptoms: Categorized in three groups—mood, cognitive, and physical symptoms. Mood symptoms include depressed, sad, or irritable mood; loss of interest in usual activities; inability to experience pleasure; feelings of guilt or worthlessness; and thoughts of death or suicide. Cognitive symptoms include inability to concentrate and difficulty in making decisions. Physical symptoms include fatigue, lack of energy, feeling either restless or slow, and changes in sleep, appetite, and activity levels (1).
Depression: Measured by the National Health and Nutrition Examination Survey (NHANES) using the Patient Health Questionnaire (PHQ–9), a nine-item screening instrument that asks about the frequency of symptoms of depression over the past 2 weeks (9). Response categories of “not at all,” “several days,” “more than half the days,” and “nearly every day” receive a score of 0–3. A total score of 0–27 is then calculated. Depression is a PHQ–9 score of 10 or higher, a well-validated cut point commonly used in clinical studies that measure depression (9). Severely depressed persons may have disproportionately chosen not to participate in the survey or health examination, which included administration of the PHQ–9; therefore, the prevalence estimates in this report may slightly underestimate the actual prevalence of depression. In addition, people being successfully treated for depression would not be identified as depressed by the PHQ–9.
Depression symptom severity: Determined by various cut points using the total score from the PHQ–9 screening instrument (9). PHQ–9 scores can be classified as: 0–4 (no or minimal depressive symptoms), 5–9 (mild), 10–14 (moderate), 15–19 (moderately severe), and 20–27 (severe). In this report, scores of 15 and higher are referred to as severe depressive symptoms.
Difficulties related to depression: Defined by responses to the question, “How difficult have these problems made it for you to do your work, take care of things at home, or get along with other people?” Only persons with a score of 1 or more on PHQ–9 symptom questions are asked the difficulties question. Responses were scored from 0 (not at all difficult) to 3 (extremely difficult). A score of 1 or more is defined as any difficulty. A score of 2 or 3 suggests moderate to severe difficulties.
Contact with a mental health professional: Determined by responses to the question, “During the past 12 months, have you seen or talked to a mental health professional such as a psychologist, psychiatrist, psychiatric nurse, or clinical social worker about your health?” The data do not indicate whether persons who contacted a mental health professional actually began treatment for depression. Respondents also are not asked about mental health treatment received from primary care providers.
Poverty status: Determined using an index calculated by dividing family income by U.S. Department of Health and Human Services poverty guidelines specific to the survey year. These guidelines are issued each year for determining financial eligibility for certain federal programs. Poverty guidelines vary by family size and geographic location; a family income-to-poverty ratio of less than 1 is the cut point for below poverty level.
Data sources and methods
NHANES, conducted by the Centers for Disease Control and Prevention’s (CDC) National Center for Health Statistics (NCHS), is a continuous cross-sectional survey of the civilian noninstitutionalized U.S. population designed to assess the health and nutrition of Americans. NHANES does not include persons living in institutions, where rates of depression are higher than in the community-dwelling population. Survey participants are asked to complete a household interview and an examination in a mobile examination center (MEC) that includes a private interview. The question about contact with a mental health professional is asked in the household interview, and the PHQ–9 depression symptom questions are asked in the MEC. For youths aged 12–15, a proxy respondent, usually a parent, answers the questions in the household interview. During the private interview in the MEC, participants aged 12 and over answer questions for themselves. Questions related to depression are administered in English and Spanish.
NHANES sample examination weights, which account for the differential probabilities of selection, nonresponse, and noncoverage, were used for all analyses. Standard errors of the percentages were estimated using Taylor series linearization, a method that incorporates the sample design and sample weights.
Differences between subgroups were evaluated using the univariate t statistic. All significance tests were two-sided using p < 0.05 as the level of significance. All comparisons reported in the text are statistically significant unless otherwise indicated. To test for linear trends (Figures 2, 4, and 5), the null hypothesis of a nonlinear trend was examined using orthogonal polynomials. Data analyses were performed using SAS version 9.1 (SAS Institute, Cary, N.C.) and SUDAAN version 9.0 (RTI International, Research Triangle Park, N.C.).
About the authors
Laura A. Pratt is with CDC’s NCHS Office of Analysis and Epidemiology; Debra J. Brody is with NCHS Division of Health and Nutrition Examination Surveys.
References
- American Psychiatric Association. Diagnostic and Statistical Manual of Mental Disorders (DSM–5). 5th ed. Arlington, VA. 2013.
- Katon WJ. Clinical and health services relationships between major depression, depressive symptoms, and general medical illness. Biol Psychiatry 54(3):216–26. 2003.
- Wells KB, Stewart A, Hays RD, Burnam MA, Rogers W, Daniels M, et al. The functioning and well-being of depressed patients: Results from the Medical Outcomes Study. JAMA 262(7):914–9. 1989.
- Wang PS, Lane M, Olfson M, Pincus HA, Wells KB, Kessler RC. Twelve-month use of mental health services in the United States: Results from the National Comorbidity Survey Replication. Arch Gen Psychiatry 62(6):629–40. 2005.
- Broadhead WE, Blazer DG, George LK, Tse CK. Depression, disability days, and days lost from work in a prospective epidemiologic survey. JAMA 264(19):2524–8. 1990.
- March J, Silva S, Curry J, Wells K, Fairbank J, Burns B, et al. The Treatment for Adolescents With Depression Study (TADS): Outcomes over 1 year of naturalistic follow-up. Am J Psychiatry 166(10):1141–9. 2009.
- Thase ME, Greenhouse JB, Frank E, Reynolds CF, Pilkonis PA, Hurley K, et al. Treatment of major depression with psychotherapy or psychotherapy–pharmacotherapy combinations. Arch Gen Psychiatry 54(11):1009–15. 1997.
- Pampallona S, Bollini P, Tibaldi G, Kupelnick B, Munizza C. Combined pharmacotherapy and psychological treatment for depression: A systematic review. Arch Gen Psychiatry 61(7):714–9. 2004.
- Kroenke K, Spitzer RL, Williams JBW. The PHQ–9: Validity of a brief depression severity measure. J Gen Intern Med 16(9):606–13. 2001.
Suggested citation
Pratt LA, Brody DJ. Depression in the U.S. household population, 2009–2012. NCHS data brief, no 172. Hyattsville, MD: National Center for Health Statistics. 2014.
Copyright information
All material appearing in this report is in the public domain and may be reproduced or copied without permission; citation as to source, however, is appreciated.
National Center for Health Statistics
Charles J. Rothwell, M.S., M.B.A., Director
Jennifer H. Madans, Ph.D., Associate Director for Science
Office of Analysis and Epidemiology
Irma E. Arispe, Ph.D., Director
Division of Health and Nutrition Examination Surveys
Kathryn S. Porter, M.D., M.S., Director
- Page last reviewed: November 6, 2015
- Page last updated: December 3, 2014
- Content source: