

Unintentional Drowning Deaths in the United States, 1999–2010
 ShareCompartir
NCHS Data Brief No. 149, April 2014
On This Page
- Key findings
- Did death rates from unintentional drowning change from 1999 through 2010?
- Were deaths due to drowning more likely to occur on weekends than on weekdays?
- How did the locations of drowning differ by sex?
- Did the risk of drowning in different places differ by age group?
- Was drowning the leading cause of death from unintentional injury for children aged 1–4 years?
- Summary
- Definitions
- Data source and methods
- About the author
- References
- Suggested citation
PDF Version (643 KB)
Jiaquan Xu, M.D.
Key findings
Data from the National Vital Statistics System, Mortality
- From 1999 through 2010, a total of 46,419 deaths from unintentional drowning (including boating) occurred in the United States, an average of 3,868 deaths per year.
- Drowning death rates decreased over time for all age groups except for adults aged 45–84.
- The average daily number of deaths from unintentional drowning on a weekend day was 48% higher than that on a weekday (13.8 versus 9.3 deaths).
- Since 2005, unintentional drowning has replaced motor vehicle traffic incidents as the leading cause of death from unintentional injury for boys aged 1–4 years.
- Drowning occurred most often in a bath tub for persons under 1 year of age and for adults aged 85 and over, in a swimming pool for children aged 1–4 years, and in natural water for persons aged 5–84 years.
Drowning is the third leading cause of death from unintentional injury worldwide, accounting for 7% of all injury-related deaths according to 2004 data from the World Health Organization (1). Previous reports indicated that, although the death rate from unintentional drowning for persons aged 0–19 years decreased in the United States, drowning had become the major cause of death from unintentional injury among children aged 1–4 years (2,3). To facilitate injury prevention programs, this study analyzed mortality data from the National Vital Statistics System from 1999 through 2010 to provide more detailed information on characteristics and patterns of unintentional drowning deaths, including recent trends and drowning by day of week, age group, sex, and place of incident.
Keywords: vital statistics, drowning, death rate
Did death rates from unintentional drowning change from 1999 through 2010?
A total of 46,419 people died from unintentional drowning in the United States from 1999 through 2010, an average of 3,868 deaths per year. Overall, the death rate from unintentional drowning decreased 9.0% from 1.44 deaths per 100,000 population in 1999 to 1.31 in 2010 (Figure 1). The rate increased 4.8% from 1.25 in 2009 to 1.31 in 2010.
Figure 1. Death rates from unintentional drowning, by age group: United States, 1999–2010
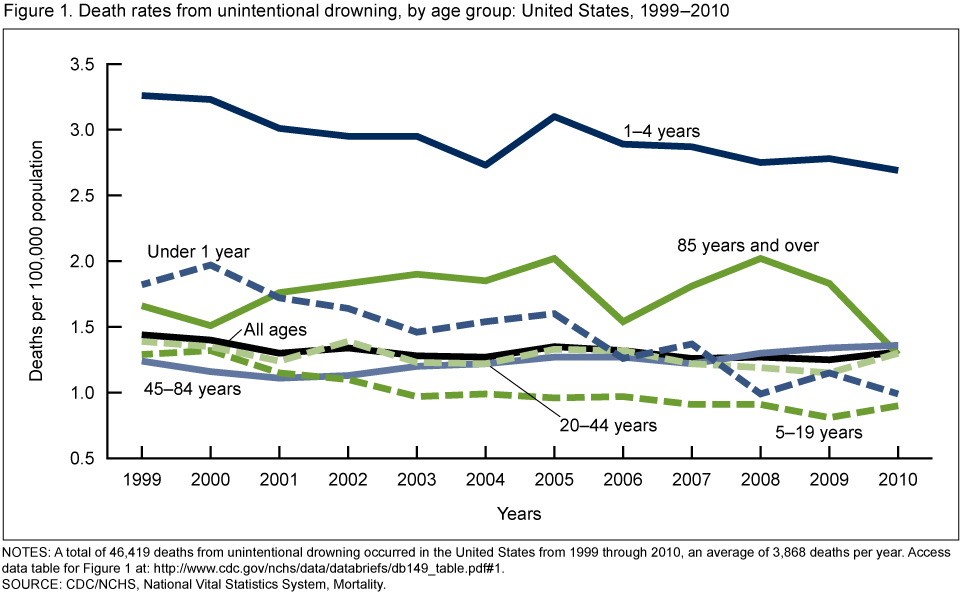
NOTES: A total of 46,419 deaths from unintentional drowning occurred in the United States from 1999 through 2010, an average of 3,868 deaths per year. Access data table for Figure 1 [PDF - 104KB].
SOURCE: CDC/NCHS, National Vital Statistics System, Mortality.
Drowning death rates decreased 45.6% for infants (under 1 year of age), 17.5% for children aged 1–4 years, and 30.2% for persons aged 5–19 years. For adults aged 85 and over, drowning death rates increased 21.7% from 1999 through 2005 and then decreased 36.1% by 2010, with a fluctuation between 2005 and 2008. Death rates increased 9.7% over the 12 years examined for adults aged 45–84.
Overall, children aged 1–4 years had the highest drowning death rate (2.93), and persons aged 5–19 years had the lowest rate (1.02) among the analyzed age groups.
Were deaths due to drowning more likely to occur on weekends than on weekdays?
Deaths from drowning were more likely to occur on a weekend than on a weekday (Figure 2). An average of 13.8 deaths per day occurred on a weekend compared with 9.3 deaths per day on a weekday in the United States from 1999 through 2010. The average number of deaths from drowning on a weekend was nearly 48% higher than that on a weekday. More than 37% of all drowning deaths occurred on weekends.
Figure 2. Average number of deaths per day from unintentional drowning, by day of week: United States, 1999–2010
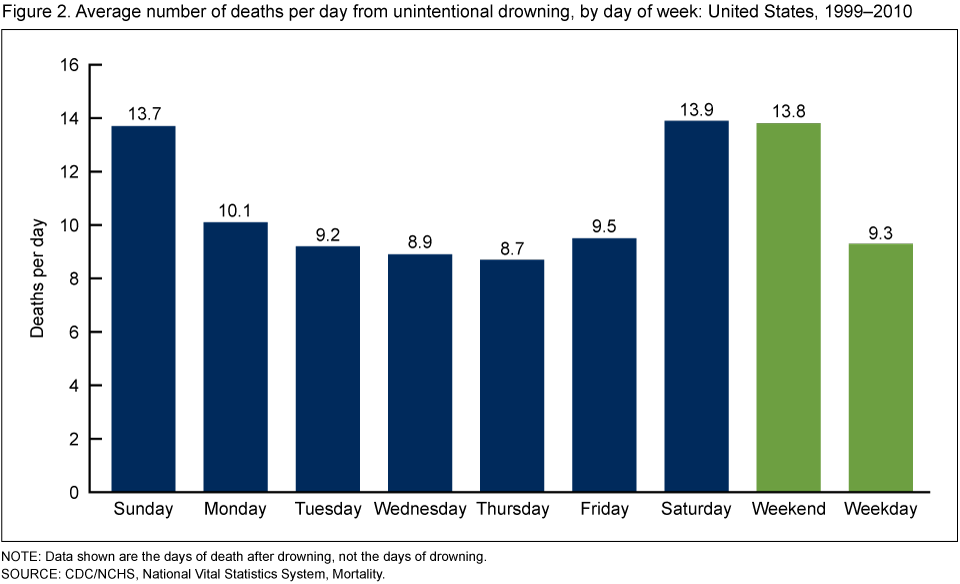
NOTE: Data shown are the days of death after drowning, not the days of drowning.
SOURCE: CDC/NCHS, National Vital Statistics System, Mortality.
How did the locations of drowning differ by sex?
People drowned in places ranging from bath tubs to natural water. Natural water was the most frequent drowning location, accounting for 47.2% of all unintentional drowning deaths (including drowning deaths while boating), followed by other/unspecified places (26.8%), swimming pools (16.3%), and bath tubs (9.7%) (Figure 3).
For males, drowning was most likely to occur in natural water; this location accounted for more than 52.7% of all unintentional drowning. For females, however, drowning occurred with approximately equal likelihood in natural water, bath tubs, and swimming pools.
Figure 3. Distribution of average annual deaths from unintentional drowning, by sex and location: United States, 1999–2010
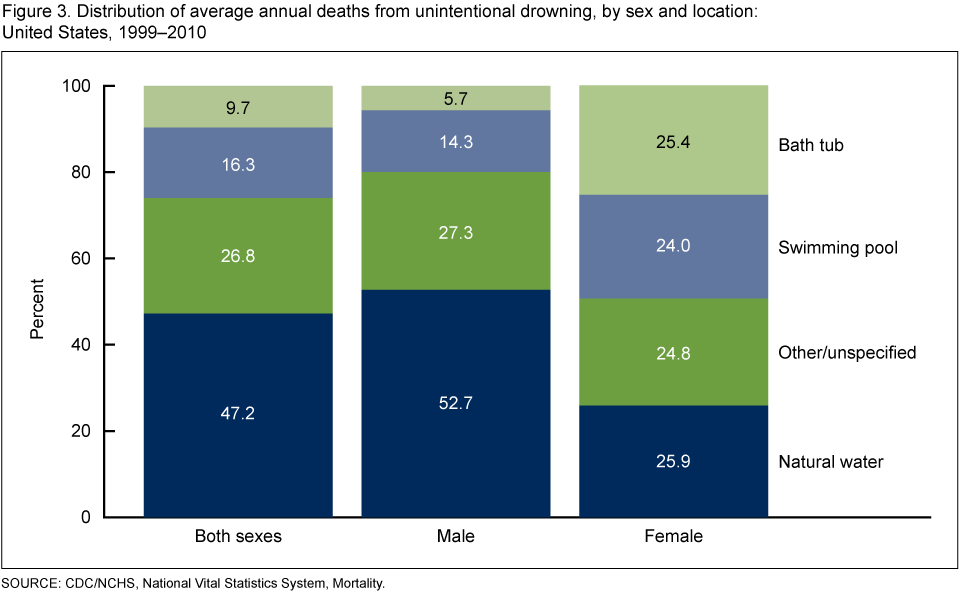
SOURCE: CDC/NCHS, National Vital Statistics System, Mortality.
Did the risk of drowning in different places differ by age group?
The risk of drowning in a particular location varied among age groups (Figure 4). Those under the age of 1 year were most likely to drown in a bath tub; this location accounted for approximately 62% of all unintentional drowning deaths for the age group. Children aged 1–4 years were most likely to drown in a swimming pool, such that this location accounted for more than 50% of all unintentional drowning deaths in that age group. Persons aged 5–19 years and adults aged 20–84 were most likely to drown in natural water; this location accounted for 50% and 54%, respectively, of all unintentional drowning deaths in those age groups. Approximately 25% of drowning deaths occurred in other or unspecified places for all age groups. Adults aged 85 and over were most likely to drown in a bath tub (0.48 deaths per 100,000 population), followed by a swimming pool (0.44) and natural water (0.40).
Figure 4. Average annual death rates from unintentional drowning, by location and age group: United States, 1999–2010
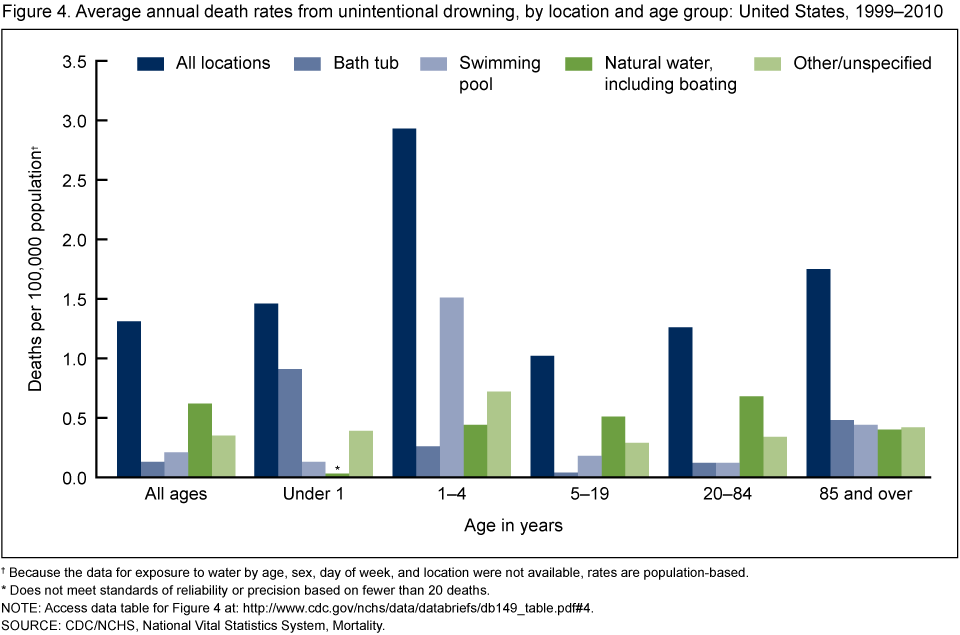
† Because the data for exposure to water by age, sex, day of week, and location were not available, rates are population-based.
* Does not meet standards of reliability or precision based on fewer than 20 deaths.
NOTE: Access data table for Figure 4 [PDF -104KB].
SOURCE: CDC/NCHS, National Vital Statistics System, Mortality.
Was drowning the leading cause of death from unintentional injury for children aged 1–4 years?
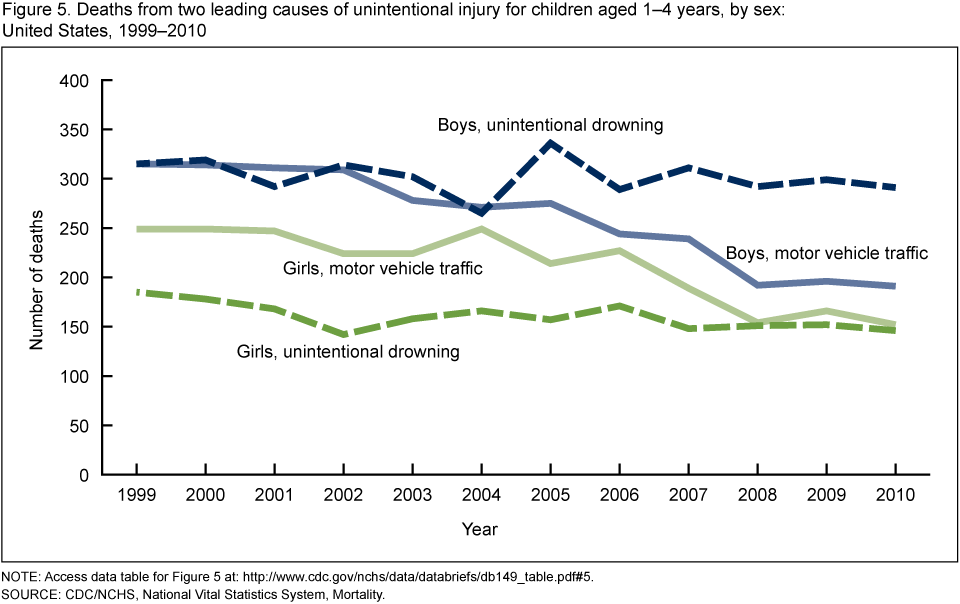
Among boys aged 1–4 years, drowning was the leading cause of death from unintentional injury in 2010, followed by motor vehicle traffic incidents; however, the two causes exchanged ranking position several times from 1999 through 2004. The number of motor vehicle traffic deaths decreased from 1999 through 2010 for both boys and girls, whereas unintentional drowning deaths did not. For boys aged 1–4 years, the number of unintentional drowning deaths surpassed the number of motor vehicle traffic deaths in 2005, becoming the leading cause of death from unintentional injury. For girls aged 1–4 years, motor vehicle traffic incidents have been the leading cause of death from unintentional injury from 1999 through 2010, although the gap between these two causes has been narrowing (Figure 5).
Figure 5. Deaths from two leading causes of unintentional injury for children aged 1–4 years, by sex: United States, 1999–2010
NOTE: Access data table for Figure 5 [PDF - 104KB].
SOURCE: CDC/NCHS, National Vital Statistics System, Mortality.
Summary
This report provides recent findings on unintentional drowning deaths in the United States. Children under 5 years of age and adults aged 85 and over had the highest risk of drowning, although the rates for these age groups reached their lowest point in 2010. Drowning death rates decreased over time for all age groups except for adults aged 45–84.
Drowning remained the second leading cause of death from unintentional injury for girls aged 1–4 years. For boys aged 1–4 years, unintentional drowning has been the leading cause of death from unintentional injury since 2005.
Patterns of drowning by place differed by sex and age. More than one-half of all drowning deaths for males occurred in natural water compared with only one-quarter of all drowning deaths for females. Drowning was most likely to occur in the bath tub for infants under the age of 1 year and for adults aged 85 and over, in swimming pools for children aged 1–4 years, and in natural water for persons aged 5–84 years. These findings are consistent with the results from previous studies (4,5). Although the percentage of drowning occurring in some locations changed slightly over time, the pattern of drowning in particular locations by sex and age remained the same.
Definitions
Cause-of-death classification: Cause of death is determined based on medical information—including injury diagnoses and external causes of injury—that is entered on death certificates filed in the United States. This information is classified and coded in accordance with the International Statistical Classification of Diseases and Related Health Problems, Tenth Revision (ICD–10) (6).
Unintentional drowning: In 2002, for statistical purposes, the World Congress on Drowning defined drowning as "the process of experiencing respiratory impairment from submersion/immersion in liquid" (7). Unintentional drowning in this report is defined as accidental drowning and submersion (ICD–10 code W65–W74), accident to watercraft causing drowning and submersion (V90), and water-transport-related drowning and submersion without accident to watercraft (V92). Intentional self-harm by drowning and submersion (X71), assault by drowning and submersion (X92), and undetermined intent of drowning and submersion (Y21) are excluded. In this report, drowning refers to fatal drowning.
Death rates: Death rates are based on populations enumerated as of April 1 in 2000 and 2010, and populations estimated as of July 1 for all other years. These population estimates are available on the National Center for Health Statistics website (8).
Leading cause of death: Leading cause of death is based on the number of deaths according to ICD–10. See the Technical Notes of "Deaths: Final Data for 2010" (9) for more detail.
Motor vehicle traffic deaths: As the underlying cause of death, motor vehicle traffic deaths are coded to V02–V04(.1, .9), V09.2, V12–V14(.3–.9), V19(.4–.6), V20–V28(.3–.9), V29–V79(.4–.9), V80(.3–.5), V81.1, V82.1, V83–V86(.0–.3), V87(.0–.8), and V89.2, according to ICD–10.
Data source and methods
All data in this report are from the 1999 through 2010 mortality files from the National Vital Statistics System. These files are available from the National Vital Statistics System Online website.
About the author
Jiaquan Xu is with CDC's National Center for Health Statistics, Division of Vital Statistics, Mortality Statistics Branch.
References
- World Health Organization. Drowning. Fact sheet no. 347. 2012.
- Gilchrist J, Ballesteros MF, Parker EM. Vital signs: Unintentional injury deaths among persons aged 0–19 years—United States, 2000–2009 [PDF - 2 MB]. MMWR 61(15):270–6. 2012.
- Borse NN, Gilchrist J, Dellinger AM, et al. CDC childhood injury report: Patterns of unintentional injuries among 0–19 year olds in the United States, 2000–2006 [PDF-2 MB]. Atlanta, GA: CDC. 2008.
- Brenner RA, Trumble AC, Smith GS, Kessler EP, Overpeck, MD. Where children drown, United States, 1995 [PDF - 329 KB]. Pediatrics 108(1):85–9. 2001.
- Laosee OC, Gilchrist J, Rudd RA. Drowning—United States, 2005–2009. MMWR 61(19):344–7. 2012.
- World Health Organization. International statistical classification of diseases and related health problems, tenth revision (ICD–10). Geneva, Switzerland. 1992.
- Beeck EF, Branche CM, Szpilman D, Modell JH, Bierens JJLM. A new definition of drowning: Towards documentation and prevention of a global public health problem [PDF - 132 KB]. Bulletin of the World Health Organization 83:853–6. 2005.
- National Center for Health Statistics, National Vital Statistics System. U.S. census populations with bridged race categories.
- Murphy SL, Xu JQ, Kochanek KD. Deaths: Final data for 2010 [PDF - 3 MB]. National vital statistics reports; vol 61 no 4. Hyattsville, MD: National Center for Health Statistics. 2013.
Suggested citation
Xu JQ. Unintentional drowning deaths in the United States, 1999–2010. NCHS data brief, no 149. Hyattsville, MD: National Center for Health Statistics. 2014.
Copyright information
All material appearing in this report is in the public domain and may be reproduced or copied without permission; citation as to source, however, is appreciated.
National Center for Health Statistics
Charles J. Rothwell, M.S., M.B.A., Director
Jennifer H. Madans, Ph.D., Associate Director for Science
Division of Vital Statistics
Delton Atkinson, M.P.H., M.P.H., P.M.P., Director
- Page last reviewed: November 6, 2015
- Page last updated: April 15, 2014
- Content source: