

Health Insurance Coverage and Adverse Experiences With Physician Availability: United States, 2012
 ShareCompartir
NCHS Data Brief No. 138, December 2013
On This Page
- Key findings
- In the 12 months prior to interview, adults aged 18–64 were more likely than other age groups to have had selected adverse experiences with physician availability.
- Among people under age 65, those who had public coverage only or were uninsured had more trouble finding a general doctor in the past year than those with private insurance.
- Among people under age 65, those who had public coverage only were more likely to have been told that a doctor's office or clinic would not accept them as new patients in the past year than those with private insurance.
- Among insured people under age 65, those who had public coverage only were more likely than those with private insurance to have been told in the past year that a doctor's office or clinic did not accept their health care coverage.
- Summary
- Definitions
- Data source and methods
- About the authors
- References
- Suggested citation
PDF Version (396 KB)
Renee M. Gindi, Ph.D.; Whitney K. Kirzinger, M.P.H.; and Robin A. Cohen, Ph.D.
Key findings
Data from the National Health Interview Survey, 2012
- In the 12 months prior to interview, 2.4% of people in the U.S. had problems finding a general doctor, 2.1% had been told that a doctor would not accept them as new patients, and 2.9% had been told that a doctor did not accept their health care coverage.
- People under age 65 who had public coverage only were more likely than those with private insurance to have these three types of adverse experiences with physician availability.
- Adults aged 18–64 who were uninsured were more likely than privately insured adults to have trouble finding a general doctor or be told that a doctor would not accept them as new patients.
- Adults aged 65 and over with Medicare only were as likely as those with both Medicare and private insurance to have these experiences with physician availability.
Rates of private insurance and public coverage have been increasing (1,2). As coverage and utilization increase, a growing concern is the availability of health care providers to meet patient needs (3). Almost 90% of general physicians accept new patients with private insurance, but less than 75% accept new patients with public coverage (e.g., Medicare, Medicaid), and the proportion of specialists accepting new patients with Medicare or Medicaid is declining (4). While most studies approach access from a provider perspective, this report examines the percentage of people who had each of three adverse experiences with physician availability in the past 12 months. Estimates were produced by age group and health insurance status using data from the 2012 National Health Interview Survey (NHIS).
Keywords: health care access, National Health Interview Survey
In the 12 months prior to interview, adults aged 18–64 were more likely than other age groups to have had selected adverse experiences with physician availability.
Figure 1. Percentage of people who had selected experiences with physician availability in the past 12 months, by age group: United States, 2012
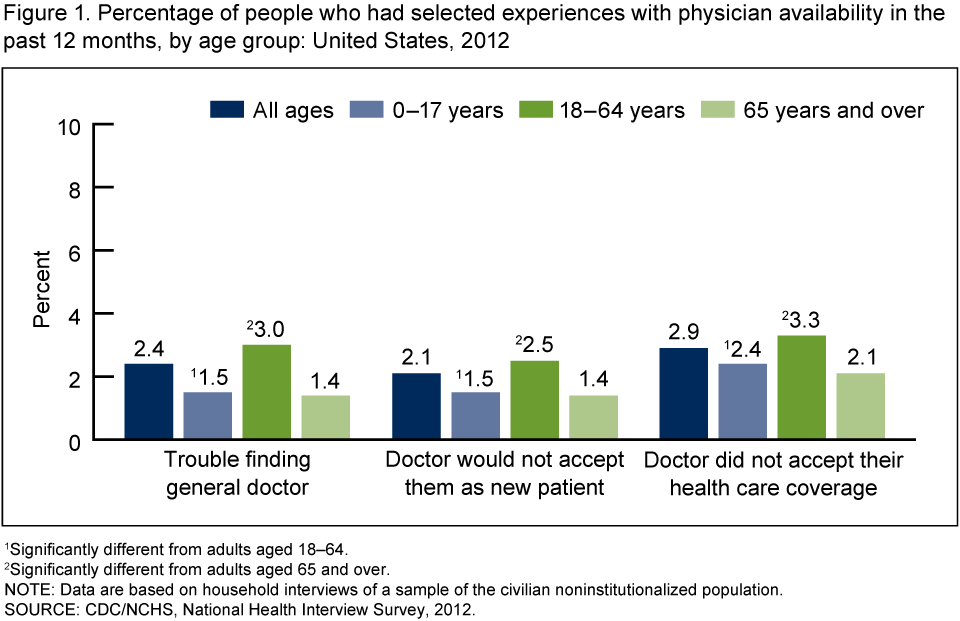
1Significantly different from adults aged 18–64.
2Significantly different from adults aged 65 and over.
NOTE: Data are based on household interviews of a sample of the civilian noninstitutionalized population.
SOURCE: CDC/NCHS, National Health Interview Survey, 2012.
Three types of experiences with physician availability were analyzed. Among people of all ages in the United States, in the 12 months prior to interview, 2.4% had problems finding a general doctor, 2.1% had been told that a doctor's office or clinic would not accept them as new patients, and 2.9% had been told that a doctor's office or clinic did not accept their health care coverage (Figure 1). Rates for each of these problems varied by age group. Adults aged 18–64 were more likely than children aged 0–17 years and adults aged 65 and over (older adults) to have had each of these experiences with physician availability. The proportions of children and older adults having each of these experiences with physician availability were similar.
Among people under age 65, those who had public coverage only or were uninsured had more trouble finding a general doctor in the past year than those with private insurance.
In 2012, in the 12 months prior to interview, 5.1% of adults aged 18–64 with public coverage only had trouble finding a general doctor (Figure 2). This was similar to the percentage of uninsured adults aged 18–64 who had trouble finding a general doctor. A similar pattern was seen among children aged 0–17 years; those who had public coverage only were just as likely to have trouble finding a general doctor in the past year (2.3%) as those who were uninsured (2.9%). In both of these age groups, those with private insurance were the least likely to have trouble finding a general doctor. Among adults aged 65 and over with Medicare, similar percentages of those with and without private insurance had trouble finding a general doctor in the past year.
Figure 2. Percentage of people who had trouble finding a general doctor in the past 12 months, by age group and health insurance status: United States, 2012
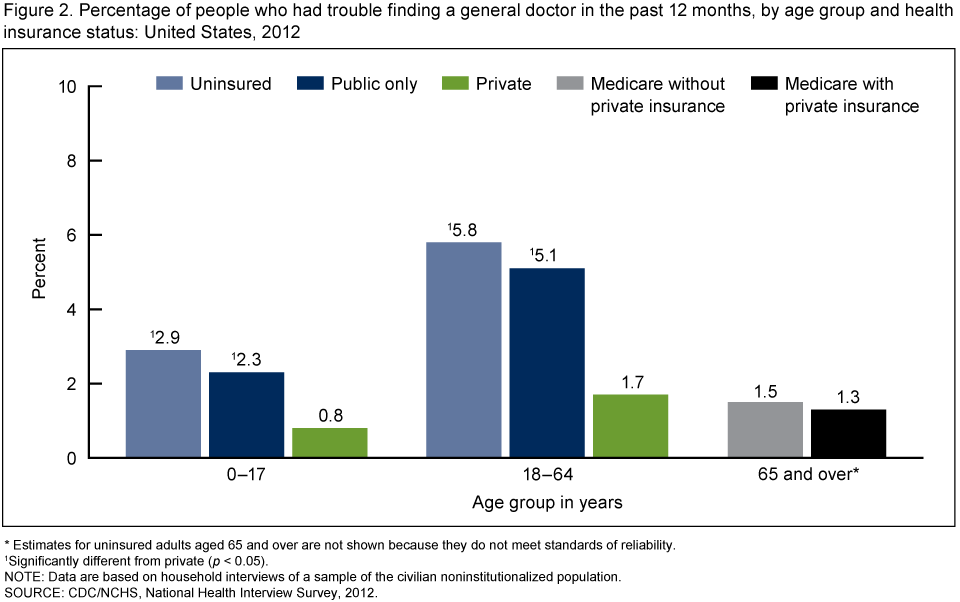
* Estimates for uninsured adults aged 65 and over are not shown because they do not meet standards of reliability.
1Significantly different from private (p < 0.05).
NOTE: Data are based on household interviews of a sample of the civilian noninstitutionalized population.
SOURCE: CDC/NCHS, National Health Interview Survey, 2012.
Among people under age 65, those who had public coverage only were more likely to have been told that a doctor's office or clinic would not accept them as new patients in the past year than those with private insurance.
In the 12 months prior to interview, adults aged 18–64 with public coverage only were almost four times as likely as those with private insurance and about twice as likely as those who were uninsured to encounter a doctor's office or clinic that would not accept them as new patients (Figure 3). These differences were less pronounced among children: Children with public coverage only (2.3%) and uninsured children (1.7%) had similar percentages of being told that a doctor's office or clinic would not accept them as new patients. However, children with public coverage only were still more than twice as likely as children with private insurance to have had this experience with physician availability. Among adults aged 65 and over with Medicare, similar percentages of those with and without private insurance were told that a doctor's office or clinic would not accept them as new patients in the past year.
Figure 3. Percentage of people who were told in the past 12 months that a doctor’s office or clinic would not accept them as new patients, by age group and health insurance status: United States, 2012
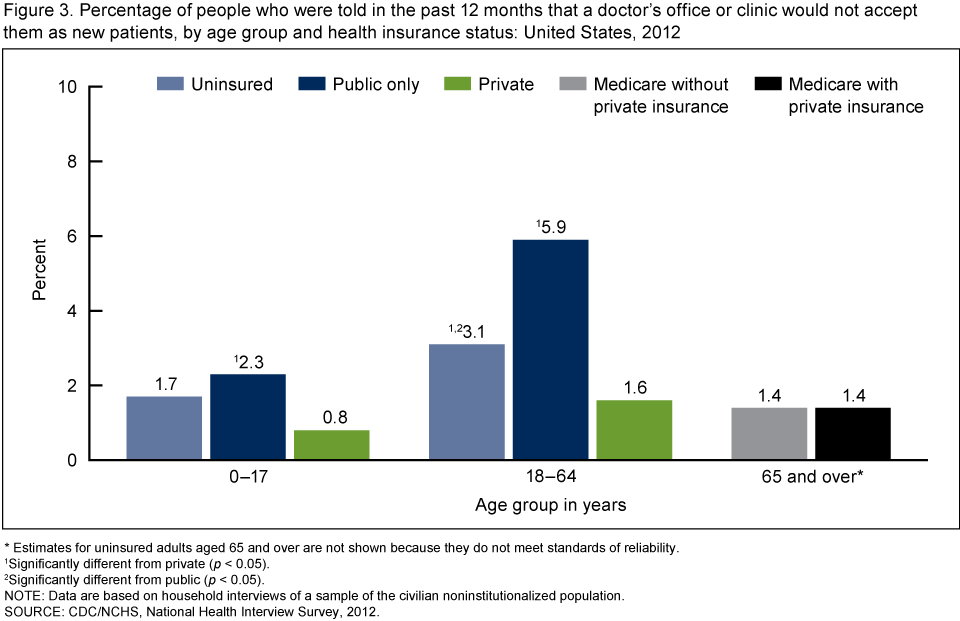
* Estimates for uninsured adults aged 65 and over are not shown because they do not meet standards of reliability.
1Significantly different from private (p < 0.05).
2Significantly different from public (p < 0.05).
NOTE: Data are based on household interviews of a sample of the civilian noninstitutionalized population.
SOURCE: CDC/NCHS, National Health Interview Survey, 2012.
Among insured people under age 65, those who had public coverage only were more likely than those with private insurance to have been told in the past year that a doctor's office or clinic did not accept their health care coverage.
In 2012, 8.3% of adults aged 18–64 with public coverage only were told that a doctor's office or clinic did not accept their health care coverage in the past year. This was more than three times higher than the percentage for adults with private insurance in that age group (Figure 4). A similar relationship was observed among children: 3.8% of children with public coverage only were told that a doctor's office or clinic did not accept their health care coverage, a percentage almost three times higher than for children with private insurance. Among older adults with Medicare, similar percentages of those with and without private insurance were told in the past year that a doctor's office or clinic did not accept their health care coverage.
Figure 4. Percentage of people with health insurance who were told in the past 12 months that a doctor’s office or clinic did not accept their health care coverage, by age group and coverage type: United States, 2012
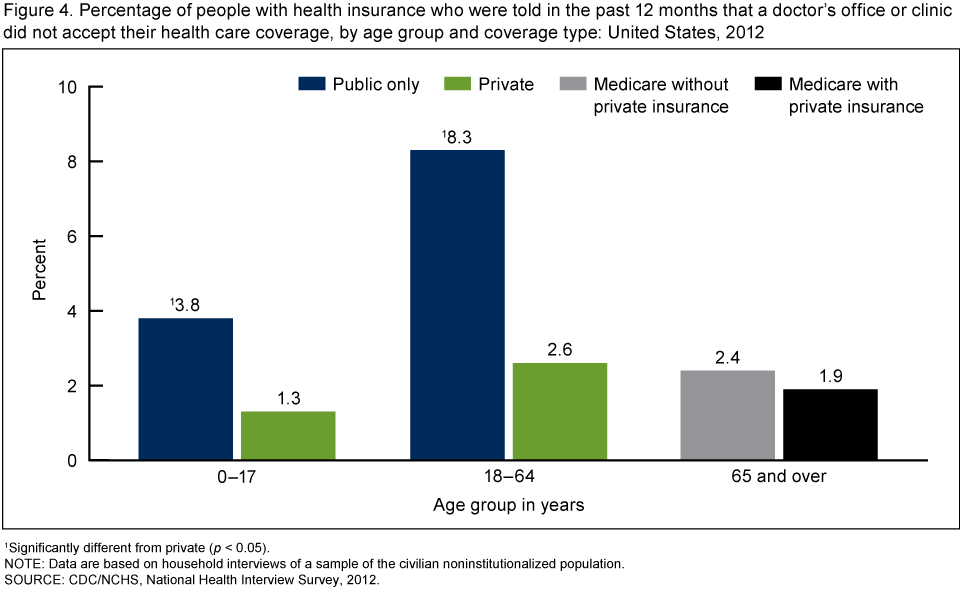
1Significantly different from private (p < 0.05).
NOTE: Data are based on household interviews of a sample of the civilian noninstitutionalized population.
SOURCE: CDC/NCHS, National Health Interview Survey, 2012.
Summary
In 2012, in the 12 months prior to interview, 2.4% of people in the United States had problems finding a general doctor, 2.1% had been told that a doctor's office or clinic would not accept them as new patients, and 2.9% had been told that a doctor's office or clinic did not accept their health care coverage. Each of these problems was experienced most often by adults aged 18–64, and rates varied by health insurance coverage. Uninsured adults aged 18–64 were as likely as adults with public coverage only to have problems finding a general doctor, but were less likely to be told that a doctor would not accept them as new patients. This is consistent with recent surveys, which indicate that while 89% of general doctors accept new self-pay patients, fewer accept new Medicare or Medicaid patients (4). While people under age 65 who had public coverage only were more likely to have these types of experiences than those with private insurance, this difference between insurance coverage types was not observed among adults aged 65 and over with Medicare: Rates were similarly low for those older Medicare-insured adults with and without additional private insurance.
Concerns about physician shortages have previously been based on provider surveys, models based on physician productivity, and ratios of the number of physicians to the size of the population (3–5). The present findings are based on a survey of the civilian noninstitutionalized population and suggest that the experiences with physician availability analyzed here are not common in all age and insurance coverage groups. However, the 2012 NHIS does not ask whether a person has tried to find a physician in the past year; those who have not tried to find a physician in the past year likely did not report having trouble finding a physician.
The three types of experiences with physician availability are neither mutually exclusive nor exhaustive; individuals may report more than one experience, and the percentages should not be added to summarize experiences with physician availability. In addition, this report represents only some aspects of experiences with physician availability. For example, people who use targeted strategies for finding a physician (e.g., lists of in-network providers, recommendations) would be less likely to report encountering doctors who would not accept their insurance or accept them as new patients. The Centers for Disease Control and Prevention's (CDC) National Center for Health Statistics (NCHS) will continue to monitor patient experiences with physician availability as insurance coverage and health care utilization rates change.
Definitions
Trouble finding a general doctor in the past 12 months: Defined by an affirmative answer to the question, "During the past 12 months, did you have any trouble finding a general doctor or provider who would see you/[child's name]?" This was asked of all sample adults and children, regardless of whether they had tried to find a doctor in the past 12 months.
Doctor's office or clinic would not accept new patients in the past 12 months: Defined by an affirmative answer to the question, "During the past 12 months, were you told by a doctor's office or clinic that they would not accept you/[child's name] as a new patient?" This was asked of all sample adults and children, regardless of whether they had tried to find a doctor in the past 12 months.
Doctor's office or clinic did not accept health care coverage in the past 12 months: Defined by an affirmative answer to the question, "During the past 12 months, were you/[child's name] told by a doctor's office or clinic that they did not accept your health care coverage?" This was asked of all sample adults and children, regardless of whether they had tried to find a doctor in the past 12 months. In Figure 1, estimates were calculated for all respondents. In Figure 4, estimates were calculated only for respondents with either public coverage or private insurance at the time of the interview.
Health insurance or health care coverage: NHIS respondents were asked about their health care coverage at the time of interview. Respondents reported whether they were covered by private health insurance (obtained through the employer or workplace, purchased directly, or purchased through a local or community program), Medicare, Medigap (supplemental Medicare coverage), Medicaid, Children's Health Insurance Program, Indian Health Service (IHS), military coverage (including VA, TRICARE, or CHAMP–VA), a state-sponsored health plan, another government program, or any single-service plan. For children aged 0–17 years and adults aged 18–64, this information was used to form three mutually exclusive categories: people with private health insurance (private), which may include people who also have public sources like Medicare; public health care coverage only (public only); and uninsured. For those aged 65 and over, this information was also used to form three mutually exclusive categories: people with Medicare and a private plan, people with Medicare who did not have a private plan (but could have other sources of coverage such as Medicaid or military coverage), and uninsured. People who only had IHS or a single-service plan were considered to be uninsured.
Data source and methods
NHIS data are collected continuously throughout the year for NCHS by interviewers from the U.S. Census Bureau. NHIS collects information about the health and health care of the civilian noninstitutionalized U.S. population. Interviews are conducted in respondents' homes, but follow-ups to complete interviews may be conducted over the telephone. Data from the 2012 NHIS were used for this analysis. Data on experiences with physician availability were gathered from 34,525 adults aged 18 and over who answered questions in the Sample Adult component, which collects detailed data from one randomly selected adult (the sample adult). Information was also collected on a total of 13,275 children from the Sample Child component of the survey, which collects additional data about one randomly selected child (the sample child). For further information about NHIS, including the questionnaire, see the NHIS website.
NHIS is designed to yield a sample representative of the civilian noninstitutionalized population of the United States, and weighting is used to produce national estimates. Data weighting procedures are described in more detail elsewhere (6). Point estimates and estimates of corresponding variances for this analysis were calculated using SUDAAN software (7) to account for the complex sample design of NHIS. The Taylor series linearization method was chosen for variance estimation. All estimates shown in this report meet the NCHS standard of reliability (relative standard error less than or equal to 30%). Differences between percentages were evaluated using two-sided significance tests at the 0.05 level. Terms such as "higher than" and "times as likely" indicate statistically significant differences. Terms such as "similar" indicate that the statistics being compared were not significantly different. Lack of comment regarding the difference between any two estimates does not necessarily suggest that the difference was tested and found to be not significant.
About the authors
Renee M. Gindi, Whitney K. Kirzinger, and Robin A. Cohen are with CDC's National Center for Health Statistics, Division of Health Interview Statistics.
References
- Cohen RA, Martinez ME. Health insurance coverage: Early release of estimates from the National Health Interview Survey, 2011 [PDF - 516 KB]. Hyattsville, MD: National Center for Health Statistics. 2012.
- Martinez ME, Cohen RA. Health insurance coverage: Early release of estimates from the National Health Interview Survey, January−September 2012 [PDF - 554 KB]. Hyattsville, MD: National Center for Health Statistics. 2013.
- Hofer AN, Abraham JM, Moscovice I. Expansion of coverage under the Patient Protection and Affordable Care Act and primary care utilization. Milbank Q 89(1):69–89. 2011.
- Hing E, Schappert SM. Generalist and specialty physicians: Supply and access, 2009–2010 [PDF - 681 KB]. NCHS data brief, no 105. Hyattsville, MD: National Center for Health Statistics. 2012.
- Access denied: A look at America's medically disenfranchised [PDF - 1.6 MB]. Washington, DC: National Association of Community Health Centers and The Robert Graham Center. 2007.
- Botman SL, Moore TF, Moriarity CL, Parsons VL. Design and estimation for the National Health Interview Survey, 1995–2004 [PDF - 300 KB]. National Center for Health Statistics. Vital Health Stat 2(130). 2000.
- RTI International. SUDAAN (Release 10.0) [computer software]. 2008.
Suggested citation
Gindi RM, Kirzinger WK, Cohen RA. Health insurance coverage and adverse experiences with physician availability: United States, 2012. NCHS data brief, no 138. Hyattsville, MD: National Center for Health Statistics. 2013.
Copyright information
All material appearing in this report is in the public domain and may be reproduced or copied without permission; citation as to source, however, is appreciated.
National Center for Health Statistics
Charles J. Rothwell, M.S., Director
Jennifer H. Madans, Ph.D., Associate Director for Science
Division of Health Interview Statistics
Jane F. Gentleman, Ph.D., Director
- Page last reviewed: November 6, 2015
- Page last updated: December 17, 2013
- Content source: