

Using this Site: Data, Trends & Maps
 ShareCompartir
Introduction
The DNPAO Data, Trends, and Maps system allows you to search for health indicators related to nutrition, physical activity, and obesity. For example, you can look up the prevalence of obesity, the percentage of adults who meet physical activity guidelines, or fruit and vegetable consumption. You can view corresponding data nationally, for states, for selected locations.
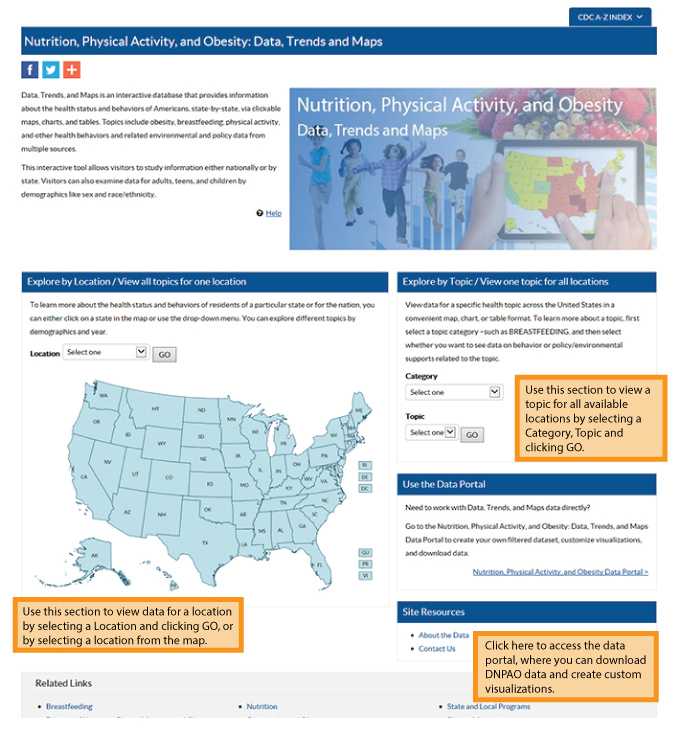
The Explore by Topic page allows you to view one topic across all available locations. Whenever available, you can use the VIEW BY-drop-down menu to view data by demographic characteristics. To begin, select a Class and then Topic from the respective drop-down lists, and click GO. By default, the system displays the data in map format. You can then choose to view the data in chart or table format.
Viewing a Map
After selecting a topic, a color-coded map displays the data for the measure. A legend explaining the colors is displayed to the right of the map.
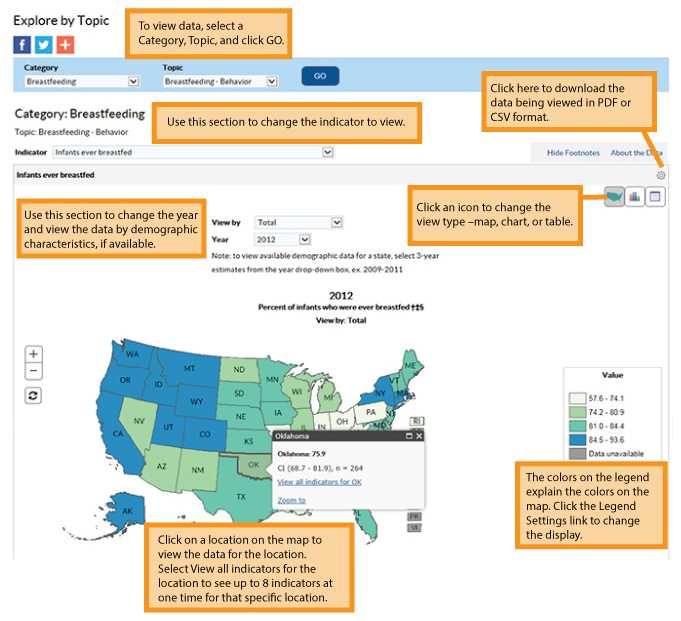
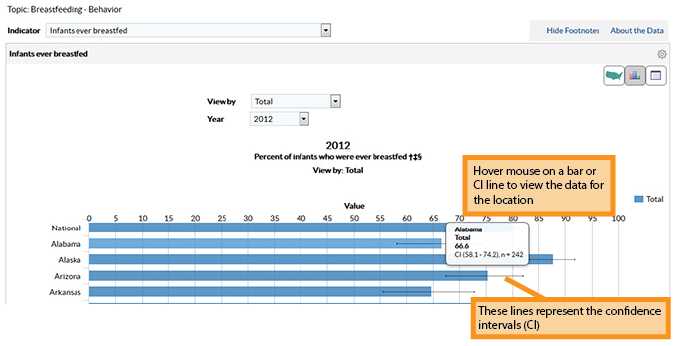
Viewing a Chart
You can view data in a bar chart format by clicking the Chart icon next to the Map icon.
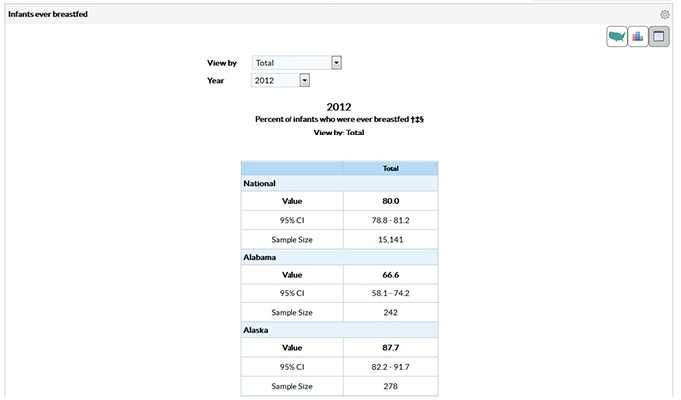
Viewing Data in Table Format
You can view data in table format by clicking the Table icon next to the Chart icon.
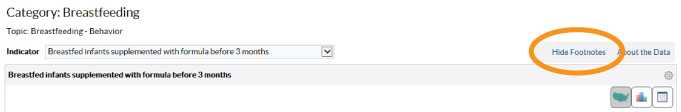
Footnotes/Notes/Data Source
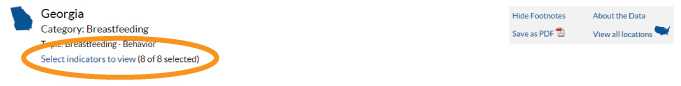
The Footnotes, Notes, and Data Source section at the bottom of a panel provides more information for the content displayed in the panel. This section explains the symbols displayed in a panel, displays important notes about the data, and also lists the data source. To hide this section, click the Hide Footnotes link circled below, to display it again, click the Show Footnotes link.
Notes
The Notes section displays more information for the data displayed on the page, such as how national estimates are calculated and additional information on inclusion criteria.
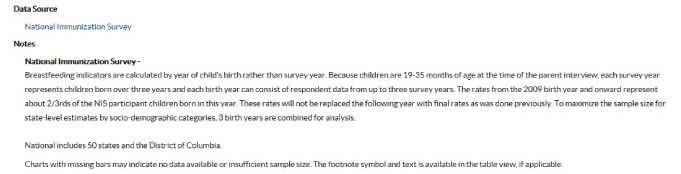
Suggested Citation
The Suggested Citation section provides citation information for the data displayed on the page.
Example:

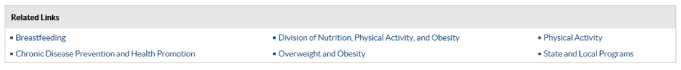
Related Links
The Related Links section contains links to other sites on the Web. These sites are not contained within the Data, Trends, and Maps Interactive Database.
Example:
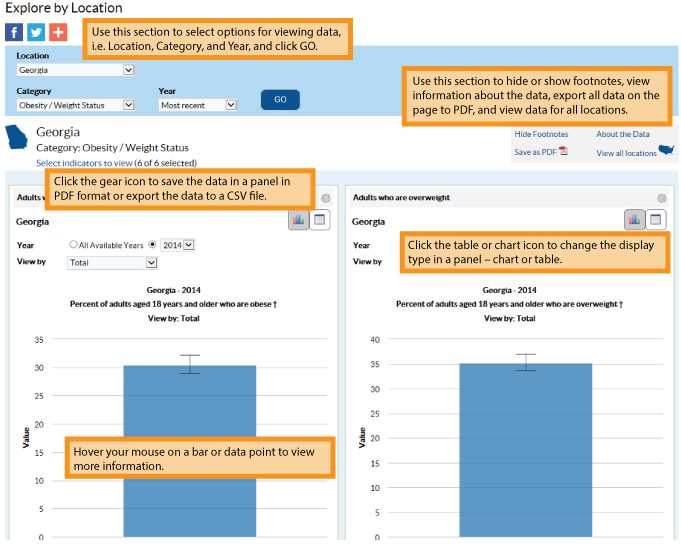
Explore by Location page allows you to select a location and view data for that location. You can select up to eight questions to display on a page. To view data, select a Location, Category, and Year from the drop-down lists and click GO. The system displays the data in one to eight small panels. When viewing data, you can view one year of data or all available years, stratify data by demographic characteristics, and view data in graph or table format.
Selecting Indicators to Display
By default, the system displays the first 8 indicators. The maximum number of indicators you can display on a page at one time is 8.
To change the indicators displayed:
1) Click the Select indicators to view link. The system displays the Select Indicators to View pop-up window.
2) Change the selected indicator(s).
Note: You cannot select more than 8 indicators.
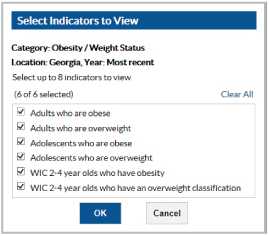
3) Click OK to keep your changes. The system displays data for the newly selected indicators on the Explore by Location page.
- Page last reviewed: May 4, 2017
- Page last updated: May 4, 2017
- Content source: