

Rate of stillbirth over time by the number of completed weeks of pregnancy: United States, 1990-2012
 ShareCompartir
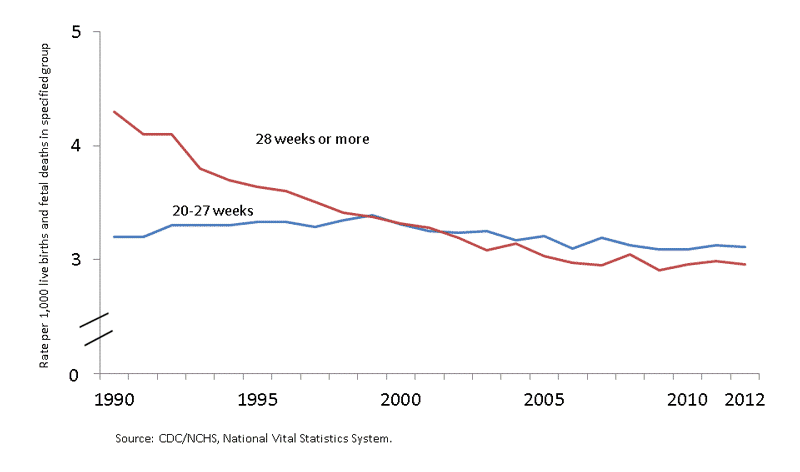
This graph shows the rate of stillbirth over time by the number of completed weeks of pregnancy in the United States from 1990 through 2012. A blue line shows the rate of early stillbirth, meaning at 20-27 completed weeks, which was pretty stable from 1990 to 2005, declined 3% between 2005 to 2006, and then stabilized again from 2006 through 2012. A red line shows the rate of late stillbirth, meaning at 28 or more completed weeks of pregnancy. The rate of late stillbirth declined 28% from 1990 to 2003, increased slightly in 2004, and then declined another 4% from 2004 to 2005. The rate of late stillbirth then stabilized was essentially unchanged from 2005 through 2012.
- Page last reviewed: December 14, 2016
- Page last updated: December 14, 2016
- Content source: