 |
|
|
|
|
|
|
| ||||||||||
|
|
|
|
|
|
|
||||
| ||||||||||
|
|
|
|
|
Persons using assistive technology might not be able to fully access information in this file. For assistance, please send e-mail to: mmwrq@cdc.gov. Type 508 Accommodation and the title of the report in the subject line of e-mail. Surveillance for Cancers Associated with Tobacco Use --- United States, 1999--2004Sherri L. Stewart, PhD1
Corresponding author: Sherri L. Stewart, PhD, 4770 Buford Highway, N.E., MS K-57, Atlanta, GA 30341; Telephone: 770-488-4616; Fax: 770-488-4335; E-mail: sstewart2@cdc.gov. AbstractProblem/Condition: Tobacco use is the leading preventable cause of disease and premature death in the United States. The 2004 Surgeon General report found convincing evidence for a direct causal relationship between tobacco use and the following cancers: lung and bronchial, laryngeal, oral cavity and pharyngeal, esophageal, stomach, pancreatic, kidney and renal pelvis, urinary bladder, and cervical cancers and acute myelogenous leukemia (AML). This report provides state-level cancer incidence data and recent trends for cancers associated with tobacco use. Because information on tobacco use was not available in the databases of the National Program of Cancer Registries (NPCR) and Surveillance, Epidemiology, and End Results (SEER) program, cases of cancer included in this report might or might not be in persons who used tobacco; however, the cancer types included in this report are those defined by the U.S. Surgeon General as having a direct causal relationship with tobacco use (i.e., referred to as tobacco-related cancer in this report). These data are important for initiation, monitoring, and evaluation of targeted tobacco prevention and control measures. Reporting Period Covered: 1999--2004. Description of Systems: Data were obtained from cancer registries affiliated with CDC's NPCR and the National Cancer Institute's SEER program; combined, these data cover approximately 92% of the U.S. population. Combined data from the NPCR and SEER programs provide the best source of information on population-based cancer incidence for the nation and are the only source of information for 41 states (including the District of Columbia) with cancer surveillance programs that are funded solely by NPCR. This report provides age-adjusted cancer incidence rates by demographic and geographic characteristics, percentage distributions for tumor characteristics, and trends in cancer incidence by sex. Results: Approximately 2.4 million cases of tobacco-related cancer were diagnosed during 1999--2004. Age-adjusted incidence rates ranged from 4.0 per 100,000 persons (for AML) to 69.4 (for lung and bronchial cancer). High rates occurred among men, black and non-Hispanic populations, and older adults. Higher incidence rates of lung and laryngeal cancer occurred in the South compared with other regions, particularly the West, consistent with high smoking patterns in the South. Interpretation: The high rates of tobacco-related cancer observed among men, blacks, non-Hispanics, and older adults reflect overall demographic patterns of cancer incidence in the United States and reflect patterns of tobacco use. Public Health Action: The findings in this report emphasize the need for ongoing surveillance and reporting to monitor cancer incidence trends, identify populations at greatest risk for developing cancer related to tobacco use, and evaluate the effectiveness of targeted tobacco control programs and policies. IntroductionTobacco use is the leading preventable cause of disease and premature death in the United States, resulting in an estimated 438,000 premature deaths annually, or nearly one of every five deaths each year (1). This estimate includes approximately 38,000 deaths attributed to exposure to secondhand smoke (1), which contains at least 250 chemicals known to be toxic (2). Forms of tobacco used in the United States include cigarettes, cigars, pipes, nonconventional imported cigarettes (e.g., bidis and kreteks [clove cigarettes]), and smokeless tobacco (i.e., snuff or chewing tobacco) (3). Tobacco use causes more deaths each year than alcohol use, car crashes, suicide, acquired immunodeficiency syndrome (AIDS), homicide, and illegal drug use combined (1,4). In addition, smoking accounts for $167 billion annually in health care expenditures and productivity losses (1). In the 1950s, the epidemiologic evidence of an association between smoking and lung cancer began to emerge, signaling one of the first warnings of smoking as a cause of cancer and other diseases (5,6). In a landmark report by Surgeon General Luther L. Terry's committee in 1964, the relationship between smoking and lung cancer in men was first classified as causal (7). Subsequent Surgeon General reports have concluded that smoking causes cancer in many other organ sites, including the urinary bladder, esophagus, kidney and renal pelvis, larynx, lung and bronchus, oral cavity and pharynx (OCP), and pancreas (7--16). In 2004, the Surgeon General expanded the sites to include cancers of the stomach and cervix and acute myelogenous leukemia (AML) (17). Thirty percent of cancer deaths, including 87% of lung cancer deaths, are attributable to tobacco use (17,18). The International Agency for Research on Cancer (IARC) also reviewed the evidence on tobacco and cancer in 1986 and in 2002 (19,20). Although the methodology used by IARC differs from that in the Surgeon General reports, their conclusions generally have been similar. Since the release of the first report of the Surgeon General in 1964, cigarette use and the prevalence of smoking in the United States have decreased. Today, more former smokers exist than current smokers, and each year approximately half of all daily smokers try to quit (21). The decrease in tobacco use since 1964 has been described as one of the 10 greatest achievements in public health in the 20th century (22); however, this rate of progress is unlikely to continue. Trends suggest that the annual rate of cessation among smokers remains fairly low, that the decrease in the smoking initiation rate might have slowed, and that overall adult smoking prevalence might remain at approximately 20%; however, prevalence varies substantially by race and ethnicity (23). Although advances have been made in knowledge of tobacco use and its health consequences, intervention strategies to reduce tobacco use must continue. Ongoing surveillance of cancer associated with tobacco use is essential to evaluate the effectiveness of tobacco control programs and policies and identify populations that would benefit from targeted cessation intervention programs or policies. Cancer incidence data are an important resource used in the prevention and control of cancer (24); these data have been used previously at the state level to measure the effectiveness of cigarette tax implementation and smoking restrictions (25). In the analysis described in this report, data were obtained from cancer registries affiliated with CDC's National Program of Cancer Registries (NPCR) and the National Cancer Institute's (NCI's) Surveillance, Epidemiology, and End Results (SEER) program to describe the incidence of tobacco-related cancers in the United States. Results are presented by demographic and tumor characteristics and by state and U.S. census region. In addition, recent trends in cancer incidence are described. Combined data from the NPCR and SEER programs provide the best source of information on population-based cancer incidence for the nation and the only source of information for 41 states (including the District of Columbia [DC]) with cancer surveillance programs that are funded solely by NPCR. MethodsData on new cases of cancer diagnosed during 1999--2004 and collected by cancer registries affiliated with the NPCR or SEER programs were included in analyses. Tobacco-related cancers were defined according to the 2004 report of the Surgeon General on The Health Consequences of Smoking (17), in which evidence was determined to be sufficient to infer a causal relationship between tobacco use and the following cancers (with corresponding site and morphology codes according to the International Classification of Diseases for Oncology, third edition [ICD-O-3]): lung and bronchus (C34), larynx (C32), OCP (C0-14), esophagus (C15), stomach (C16), pancreas (C25), kidney and renal pelvis (C64--65), urinary bladder (C67), cervix (C53), and AML (M9840, 9861, 9866, 9867, 9871--9874, 9891, 9895--9897, 9910, 9920) (26,27). Because information on tobacco use was not available in the NPCR or SEER databases, cases of cancer included in this report might or might not be in persons who used tobacco; however, the cancer types included in this report are those defined as tobacco related by the Surgeon General (i.e., having a direct causal relationship with tobacco use). CDC analyzed the most recent data available: data reported to NPCR as of January 31, 2007, and to SEER as of November 2006 and made available through a limited-use data file in April 2007. For demographic, tumor, and trend analyses (Tables 1--11), diagnoses during 1999--2004 from 44 states and DC were included because data from these states and DC for this time period were considered high quality according to the United States Cancer Statistics publication criteria (27); these data represent 92.1% of the U.S. population. For state and regional analyses (Figures 1--19), diagnoses from 2004 from 49 states and DC were used. Using a single year of data resulted in a greater number of states with high-quality data (27); these data represent 98.1% of the U.S. population. For the U.S. Census regions, these data represent 100% of the U.S. population for the Northeast, Midwest, and West and 94.1% for the South. U.S. Census regions were defined according to the U.S. Census Bureau (available at http://www.census.gov/popest/geographic). Other than for urinary bladder cancer, only cases of invasive cancer were included. Cases of urinary bladder cancer include in situ tumors that are routinely recoded as invasive for the purpose of cancer incidence reporting because of historical difficulties in distinguishing between the two types (28). Only microscopically confirmed cancer cases were included in tumor analyses (i.e., histology, stage, and grade). Rates and corresponding 95% confidence intervals (CIs) were calculated for age, race, ethnicity, and sex. Data for American Indian/Alaska Natives (AI/ANs) were cross-checked with Indian Health Service (IHS) records to decrease the number of AI/ANs who were misclassified as nonnative (29). The North American Association of Central Cancer Registries Hispanic Identification Algorithm was applied to Hispanic ethnicity data to reduce misclassification of Hispanics as being of unknown ethnicity. Incidence rates, per 100,000 persons, are age adjusted by 19 age groups to the 2000 U.S. standard population by the direct method (27). Population estimates used as denominators in the rate calculations are from the U.S. Census Bureau and modified by SEER to increase the accuracy of rates (27). The SEER modification is used to reduce the estimated white population and increases the estimated Asian/Pacific Islander (A/PI) population for Hawaii because of concerns that the Native Hawaiian population has been substantially undercounted in previous censuses. The estimates for the total population, black population, and AI/AN populations in Hawaii are not modified. Statistical testing for differences in rates was not performed because of issues with multiple comparisons. CIs were calculated as modified gamma intervals (30) and are presented to allow for informal comparisons among rates. Although examining overlap between CIs to determine significance is conservative (31), the power for detecting differences in rates with this method is still very high with 6 years of national data. All rate calculations were performed using SEER*Stat (available at http://seer.cancer.gov/seerstat). Percentages for tumor characteristics (i.e., histology, stage, and grade) were calculated for all cancer types except AML. Histology categories were organized according to ICD-O-3 morphology codes (26). Cystic, mucinous, and serous adenocarcinomas were combined into one adenocarcinoma category. Histology categories for each cancer site were determined by incidence or clinical relevance. Cancer cases were staged as localized, regional, distant, or unknown* using the 2000 SEER summary staging system, a system routinely used by cancer registries, incorporating information from the American Joint Committee on Cancer staging system (32). Because SEER summary staging guidelines changed substantially beginning with diagnoses made in 2001 (32) and the method used by registries to stage cases changed in 2004, all stage analyses were limited to diagnoses occurring during 2001--2003. For urinary bladder cancer cases, the localized stage includes in situ cases. Linear trends in the age-adjusted incidence rates were calculated as an estimated annual percentage change (EAPC) during the study period (1999--2004) using the weighted least squares method in SEER*Stat. P values <0.05 for the two-sided hypothesis test that the EAPC is equal to zero were considered statistically significant. ResultsLung and Bronchial CancerA total of 1,095,305 lung and bronchial cancer cases (69.4 per 100,000 persons) were diagnosed in the United States during 1999--2004 (Table 1). Incidence rates were substantially higher among men (89.6) compared with women (54.7). Among persons aged <80 years, rates increased with increasing age and peaked among persons aged 70--79 years (424.4). Among men, blacks had the highest rates (111.0), followed by white men (88.7). A/PI and AI/AN men had similar rates (52.9 and 52.8, respectively). Among women, whites had the highest rates (56.0), followed by blacks (50.3), AI/ANs (35.7), and A/PIs (27.2). Rates were nearly two times higher among non-Hispanics compared with Hispanics (71.8 and 37.4, respectively). Among those with known tumor characteristics, a total of 75.5% of all lung and bronchial cancer cases were non--small cell carcinomas. Men had greater percentages of squamous cell carcinoma than women (26.0% and 17.3%, respectively), whereas women had greater percentages of adenocarcinomas than men (40.7% and 33.1%, respectively). Almost half (46.5%) of lung and bronchial cancer cases were diagnosed at the distant stage; in addition, almost half were of unknown grade (43.4%), followed by poorly differentiated grade (28.7%). Among men in 2004, lung and bronchial cancer incidence rates were highest in the South region of the United States (97.9) and lowest in the West (66.0) (Figure 1). Among women, rates were similar in the South, Midwest, and Northeast regions (55.3--56.4) and were lowest in the West (48.1) (Figure 2). Arkansas, Delaware, Kentucky, Maine, Oklahoma, and West Virginia had some of the highest rates of lung and bronchial cancer among both men (98.9--133.2) and women (59.8--75.5) (Figures 1 and 2). Laryngeal CancerA total of 67,618 cases (4.3 per 100,000 persons) of laryngeal cancer were diagnosed in the United States during 1999--2004 (Table 2). Incidence rates were substantially higher among men (7.6) compared with women (1.6). Among persons aged <80 years, rates increased with increasing age and peaked among those aged 70--79 years (19.3). Blacks had the highest rates (6.3 per 100,000 persons), followed by whites (4.1), AI/ANs (2.2), and A/PIs (1.5). Rates were higher among non-Hispanics than Hispanics (4.3 and 3.4, respectively). Among those with known tumor characteristics, almost all (96.5%) laryngeal cancer cases were squamous cell carcinomas. The majority (57.2%) were diagnosed at a localized stage; however, a smaller percentage of localized cases occurred among women (51.5%) than men (58.7%). Women had greater percentages of regional stage laryngeal cancer diagnoses than men (32.4% and 24.3%, respectively), whereas men had slightly greater percentages of distant stage diagnoses than women (9.8% for men and 8.1% for women). Almost half (46.3%) of laryngeal cancer cases were moderately differentiated at diagnosis. Among men in 2004, laryngeal cancer incidence rates were highest in the South (8.4) region of the United States and lowest in the West (4.8) (Figure 3). Among women, rates were similar in the South, Midwest, and Northeast regions (1.6--1.7) and were lowest in the West (1.1) (Figure 4). Alabama, Arkansas, Kentucky, and Louisiana had some of the highest rates of laryngeal cancer cases among both men (8.4--10.7) and women (2.1--2.6) (Figures 3 and 4). Oral Cavity and Pharyngeal CancerA total of 169,043 cases (10.6 per 100,000 persons) of OCP cancer were diagnosed in the United States during 1999--2004 (Table 3). Incidence rates were substantially higher among men (16.0) compared with women (6.1). Among persons aged <80 years, rates increased with increasing age and leveled among persons aged >70 years (40.3 among those aged 70--79 years and 38.3 among those aged >80 years). Among men, blacks had the highest rates (18.1), followed by white (15.8), A/PI (10.6), and AI/AN (9.5) men. Among women, whites had the highest rates (6.1), followed by black (5.6), A/PI (5.3), and AI/AN women (3.7). Rates were higher among non-Hispanics than Hispanics (11.0 and 7.2, respectively). The highest rates of OCP cancer in men occurred in the oral cavity (7.1) and tonsils (2.4) and in women occurred in the oral cavity (3.3) and salivary glands (0.9). Among those with known tumor characteristics, the majority of OCP cancers were squamous cell carcinomas (83.7%). Most were diagnosed at the localized (36.5%) or regional (46.6%) stage. However, a greater percentage of cases were diagnosed at the localized stage among women (43.7%) than men (33.2%), and a greater percentage of cases diagnosed at the regional stage occurred among men (49.7%) compared with women (39.7%). The majority of OCP cancers were moderately (36.0%) or poorly (23.8%) differentiated at diagnosis. In 2004, rates of OCP cancer were similar by region among men (14.7--16.9) and women (5.7--6.0) (Figures 5 and 6). Alabama, Florida, and Louisiana had some of the highest rates of OCP cancers among both men (17.2--20.2) and women (6.3--9.6) (Figures 5 and 6). Esophageal CancerA total of 78,561 cases (5.0 per 100,000 persons) of esophageal cancer were diagnosed in the United States during 1999--2004 (Table 4). The incidence rate was higher among men (8.6) compared with women (2.1). Rates were highest among men aged 70--79 years (45.1) and women aged >80 years (14.4). Rates were highest among blacks (6.9), followed by whites (4.8), AI/ANs (3.1), and A/PIs (2.4). Rates were higher among non-Hispanics (5.1) than Hispanics (3.3). Among those with known tumor characteristics, approximately half (56.7%) of all esophageal cancer cases were adenocarcinomas, and approximately one third (36.9%) were squamous cell carcinomas. A similar pattern existed among men (62.8% adenocarcinomas, 31.2% squamous cell carcinomas). However, the pattern differed among women, who had greater percentages of squamous cell carcinomas (55.8%), followed by adenocarcinomas (36.7%). Stage at diagnosis was fairly evenly distributed among localized (23.0%), regional (29.7%), and distant (28.6%) disease. Men had slightly smaller percentages of localized disease (22.3%) than women (25.4%) and slightly greater percentages of distant disease (30.3%) than women (22.9%). A substantial percentage (41.2%) of esophageal cancer cases were poorly differentiated. In 2004, esophageal cancer rates among men were highest in the Northeast (9.8) and lowest in the West (7.8) (Figure 7). Rates among women were highest in the Northeast and Midwest (2.2) and lowest in the West (1.8) (Figure 8). Connecticut, Delaware, New Hampshire, Rhode Island, and Wisconsin had some of the highest rates of esophageal cancer among men (10.1--13.4) and women (2.4--4.1) (Figures 7 and 8). Stomach CancerA total of 115,245 cases (7.3 per 100,000) of stomach cancer were diagnosed in the United States during 1999--2004 (Table 5). Incidence rates were higher among men compared with women (10.4 and 4.9, respectively). Rates increased with increasing age and peaked among persons aged >80 years (54.2). A/PIs had the highest rates (14.1), followed by blacks (12.2), AI/ANs (7.1), and whites (6.5). Hispanics had higher rates than non-Hispanics (11.9 and 7.0, respectively). Among those with known tumor characteristics, 90% of stomach cancers were adenocarcinomas (90.3%); gastrointestinal stromal tumors accounted for 3.4%. Approximately 62% of stomach cancers were diagnosed at the regional or distant stage (61.9%), with women having greater percentages of localized stage cancer than men (24.8% and 21.7% respectively). Approximately 50% of stomach cancers were poorly differentiated. In 2004, stomach cancer rates were highest among men in the Northeast (11.7) and lowest in the Midwest and South (9.0) (Figure 9). Rates among women were highest in the Northeast (5.6) and lowest in the Midwest (3.9) (Figure 10). Connecticut, Hawaii, New Jersey, and New York had some of the highest rates of stomach cancer among men (10.2--18.4) and women (5.1--6.7) (Figures 9 and 10). Pancreatic CancerA total of 176,409 cases (11.2 per 100,000 persons) of pancreatic cancer were diagnosed in the United States during 1999--2004 (Table 6). Incidence rates were higher among men compared with women (12.8 and 9.8, respectively). Rates increased with increasing age and peaked among persons aged >80 years (83.8). Blacks had the highest rates (14.5), followed by whites (10.9), A/PIs (8.6), and AI/ANs (7.2). Non-Hispanics had higher rates than Hispanics (11.2 and 10.3, respectively). Among those with known tumor characteristics, 76.4% of cases of pancreatic cancer were adenocarcinomas, and 5.7% were mucinous adenocarcinomas. Ductal carcinomas accounted for 6.1% of pancreatic cancer diagnoses. Approximately half (51.6%) of pancreatic cancer cases were diagnosed at the distant stage; 8.1% of pancreatic cancers were diagnosed at the localized stage. The majority (53.8%) of pancreatic cancer cases were of unknown grade at diagnosis. Among men in 2004, pancreatic cancer rates were highest in the Northeast (13.8) and lowest in the West (11.7) (Figure 11). Rates among women were highest in the Northeast (10.9) and lowest in the Midwest (9.2) (Figure 12). Connecticut, DC, Louisiana, New Jersey, and New York had some of the highest rates of pancreatic cancer among men (13.7--14.8) and women (10.9--12.3) (Figures 11 and 12). Kidney and Renal Pelvis CancerA total of 210,331 cases (13.3 per 100,000 persons) of kidney and renal pelvis cancers were diagnosed in the United States during 1999--2004 (Table 7). Incidence rates were almost twice as high among men (18.1) compared with women (9.4). In persons aged <80 years, rates increased with increasing age and peaked among men and women aged 70--79 years (83.9 and 42.7, respectively). Blacks had the highest rates (13.6), followed by whites (13.4), AI/ANs (12.4), and A/PIs (6.0). Rates were similar among non-Hispanics (13.3) and Hispanics (13.1). Among those with known tumor characteristics, the majority (87.1%) of cases of kidney cancer were adenocarcinomas, with either renal cell carcinoma (53.7% of the total cases for which histologic characteristics were known) or clear cell adenocarcinoma (20.8% of the total cases for which histologic characteristics were known) as the major adenocarcinoma subtypes. At diagnosis, 63.2% of cases of kidney cancer were at a localized stage, and 31.4% of cases were moderately differentiated. Among men in 2004, kidney cancer incidence rates were highest in the Northeast, South, and Midwest regions of the United States (20.4, 19.7, and 19.3, respectively) and lowest among men in the West (17.0) (Figure 13). Similarly, among women, rates were highest in the Midwest, Northeast, and South regions (10.7, 10.3, and 10.3, respectively) and lowest in the West (8.5) (Figure 14). Illinois, Indiana, Louisiana, Rhode Island, and Texas had some of the highest rates of kidney cancer among men (20.2--23.5) and women (10.8--14.0) (Figures 13 and 14). Urinary Bladder CancerA total of 342,515 urinary bladder cancer cases (21.7 per 100,000 persons) were diagnosed in the United States during 1999--2004 (Table 8). Incidence rates were approximately four times higher among men (38.2) compared with women (9.7). Rates increased with increasing age and peaked among persons aged >80 years (321.7 and 74.5, respectively). Whites had the highest rate (22.9), followed by blacks (11.4), A/PIs, (8.8), and AI/ANs (7.5). Rates were higher among non-Hispanics (22.4) than Hispanics (12.3). Among those with known tumor characteristics, the majority of cases of urinary bladder cancer were transitional cell carcinomas (94.0%). At diagnosis, 31.3% of urinary bladder cancers were moderately differentiated and nearly all (99.5%) were diagnosed at a localized stage. Among men in 2004, urinary bladder cancer incidence rates were highest in the Northeast region of the United States (44.7) and lowest in the South (34.1) (Figure 15). Among women, bladder cancer incidence rates were highest in the Northeast (11.8) and lowest in the South and West (8.8) (Figure 16). Connecticut, Delaware, Maine, Massachusetts, Minnesota, New Hampshire, New Jersey, New York, Rhode Island, and Vermont had some of the highest rates of bladder cancer among men (41.6--54.6) and women (10.9--13.9) (Figures 15 and 16). Cervical CancerA total of 72,878 cervical cancer cases (8.9 per 100,000 women) were diagnosed among women in the United States during 1999--2004 (Table 9). Women aged 40--49 years had the highest rates of cervical cancer (15.6). Rates were highest among blacks (12.5), followed by whites (8.4), A/PIs (8.2), and AI/ANs (6.8). Rates were higher among Hispanics (14.0) compared with non-Hispanics (8.4). Among those with known tumor characteristics, the majority of cervical cancer cases were squamous cell carcinomas (70.8%); adenocarcinomas accounted for 22.7%. Approximately half (50.7%) of cervical cancer cases were diagnosed at the localized stage, and approximately one third (32.7%) were at the regional stage at diagnosis. Most cervical cancers were of unknown grade (32.5%), poorly differentiated (28.5%), or moderately differentiated (28.3%). In 2004, cervical cancer rates were highest in the South (8.6) and lowest in the Midwest and West (7.4) (Figure 17). Arkansas, DC, Florida, Kentucky, Louisiana, Maine, Mississippi, New Jersey, New Mexico, Rhode Island, Texas, West Virginia, and Wyoming had the highest rates of cervical cancer (8.8--13.2) (Figure 17). Acute Myelogenous LeukemiaA total of 62,708 AML cases (4.0 per 100,000 persons) were diagnosed in the United States during 1999--2004 (Table 10). Incidence rates were higher among men compared with women (4.9 and 3.3, respectively). Rates increased with increasing age and peaked among persons aged >80 years (23.0). Whites had the highest rates (4.1), followed by blacks (3.2), A/PIs (3.1), and AI/ANs (2.1). Non-Hispanics had higher rates than Hispanics (4.0 and 3.4, respectively). Among men in 2004, AML incidence rates were highest in the Northeast (5.0) and lowest in the West (4.3) (Figure 18). Rates among women were highest in the Northeast and Midwest (3.4) and lowest in the West (2.9) (Figure 19). Illinois, Maine, and Rhode Island had some of the highest rates of AML among men (5.2--9.0) and women (3.6--5.0) (Figures 18 and 19). Estimated Annual Percentage Change in Incidence Rates of Tobacco-Related CancersDuring 1999--2004, significant decreases in cancers of the lung and bronchus (0.91% per year), larynx (2.75%), OCP (0.58%), stomach (1.62%), and urinary bladder (0.39%) occurred among men and women combined (Table 11). A significant decrease also occurred in cervical cancer among women (4.10%). Although lung and bronchial cancer rates decreased overall, rates remained stable among women (p = 0.53). The decrease in OCP rates was greater among women (1.30%, p = 0.01) than men (0.45%, p = 0.06). A significant increase in kidney cancer (3.14% per year) occurred among men and women combined. Significant changes in esophageal and pancreatic cancer and AML did not occur. DiscussionInterpretation of Tobacco-Related Cancer IncidenceApproximately 2.4 million cases of tobacco-related cancer were diagnosed in the United States during 1999--2004, with lung and bronchial cancer accounting for almost half of these diagnoses. The incidence of tobacco-related cancers was higher among men compared with women. Black and non-Hispanic populations had consistently higher incidence rates than other racial and ethnic populations, with a few exceptions. The majority of tobacco-related cancers occurred among persons aged >70 years. The high rates among men, blacks, non-Hispanics, and older adults reflect overall demographic patterns of cancer incidence in the United States (27) and also reflect patterns of tobacco use. In 2006, an estimated 20.8% of all adults in the United States (45.3 million persons) smoked cigarettes, with smoking being more common among men (23.9%) compared with women (18.0%) (23). The prevalence of cigarette smoking varies among racial and ethnic minority groups; the highest prevalence is among AI/ANs (32.4%), followed by blacks (23.0%), whites (21.9%), Hispanics (15.2%), and A/PIs (10.4%) (23). Although AI/ANs did not have the highest tobacco-related cancer incidence rates overall, incidence rates for this population are known to be substantially underestimated in registry data because of misclassification of race in medical records (29). The relatively lower cancer incidence rates among AI/ANs in this report might be a reflection of this misclassification. Blacks had the highest tobacco-related cancer incidence rates in this report and have the second-highest smoking prevalence among racial and ethnic populations. Some reports suggest that in addition to high smoking rates, blacks might have increased susceptibility to the carcinogens in tobacco smoke or might have increased exposure to carcinogens through increased depth and frequency of inhalation (33). The incidence rates in this report generally are higher than those reported using SEER data alone from 2000--2004 (which cover 26% of the U.S. population) (34), with the exception of stomach cancer. The higher rate of stomach cancer reflected by SEER data might be a result of higher proportions of A/PIs represented in the SEER program compared with in the United States, which might result in higher incidence rates for cancers that affect A/PIs (35). The higher incidence rates for cancers other than stomach cancer in the combined NPCR and SEER data set compared with SEER data alone are likely a result of the inclusion of data from additional states in the combined data set, especially states with a higher prevalence of tobacco use. Substantial variation in smoking prevalence exists by state among adults in the United States. The states with the highest prevalence of current smokers are located in the South: Kentucky (28.6%), West Virginia (25.7%), Oklahoma (25.1%), and Mississippi (25.1%) (36). Lung, laryngeal, and cervical cancer incidence rates were highest in the South; Kentucky had the highest rates of lung and laryngeal cancers among both men and women. States with the lowest smoking rates were in the West: Utah (10.4%), California, (18.5%), and Montana (18.5%) (36). Cancer incidence rates were consistently lowest in the West for all the cancers in this report, with the exception of stomach cancer. Cancers of the lung and bronchus, larynx, and OCP have the greatest average relative risks associated with tobacco use (37) (Table 12). Lung cancer is the second most commonly diagnosed cancer in men (after prostate cancer) and women (after breast cancer) and is the leading cause of cancer death among both men and women in the United States (27). The average tobacco-related lung cancer relative risk is 15.0--30.0 (37). Tobacco use causes all histologic types of lung cancer; however, differences in smoking patterns and exposures to other lung carcinogens result in variations in incidence by histologic type (38). Consistent with previous studies, the results of this study demonstrate that squamous cell carcinoma rates are higher among men, whereas adenocarcinoma rates are higher among women (38). Adenocarcinoma rates increased in the 1980s and 1990s (39), and adenocarcinoma is now the most common type of lung cancer among smokers (17,20). Certain data suggest that changes in the cigarette composition, carcinogen levels in cigarette smoke, and smoking behaviors are responsible for the changing histologic characteristics of lung cancer among smokers (40); however, the direct relationship of these factors to these changes has not been established (17,20). The introduction of filters and the modification of cigarette design and composition to reduce the machine-tested level of tar and nicotine has resulted in smokers inhaling more frequently and deeply and other compensatory smoking behaviors to sustain nicotine intake (40). As a result, cigarette smoke comes into direct contact with more of the lung periphery (i.e., the site where adenocarcinoma develops) than with the central lung and bronchus (i.e., the site where squamous cell carcinoma develops) (17,20,40). In addition, changes in cigarette design, composition, and tobacco blends have been associated with changes in the level of carcinogens consistent with the changes in the incidence of histologic types (i.e., reductions in polynuclear aromatic hydrocarbons and increases in tobacco-specific nitrosamine levels) (17,20,40). The significant decrease in lung cancer rates that occurred among men but not among women in this study is consistent with other studies (38) and is related to historical patterns of smoking prevalence. Smoking prevalence continued to increase among women as it was decreasing among men, leading to diverging patterns of lung cancer incidence between men and women (41). Laryngeal cancer is relatively rare in the United States (27). The tobacco-related relative risk for laryngeal cancer is 10.0 (37). A recent case-control study confirms that tobacco use is the most substantial risk factor for laryngeal cancer (42). In addition to tobacco use, alcohol use has an important etiologic role in the formation of laryngeal cancer, and these two factors have a synergistic effect on laryngeal cancer risk (42). Diets low in vegetable consumption also might increase the risk for laryngeal cancer among women smokers (42). In this study, the high incidence rates of both lung and laryngeal cancer in the South are consistent with smoking patterns and reflect the strong association of these cancers with tobacco use. OCP cancer is the eighth most common cancer in the United States among men but is less common among women (27). This type of cancer includes tumors with origins in several anatomic organs of the head and neck. Strong evidence associates tobacco as the carcinogenic factor in squamous cell cancer of the head and neck (43), which the findings from this study indicate is the predominant histologic type of OCP cancers in the United States. Smokeless tobacco use also is strongly associated with OCP cancer (44), and the average relative risk for tobacco-related OCP cancer is 4.0--5.0 (37). Alcohol is a strong risk factor for OCP cancer as well, and studies have shown that the use of both tobacco and alcohol has a synergistic effect on the development of OCP cancer, together accounting for 80%--90% of all cases of OCP cancers (43,45). Among women, OCP cancers were highest among whites, a finding that might partly be related to the higher prevalence of smokeless tobacco use among white men and women (44). Cancers of the pancreas and urinary bladder have similar relative risks associated with tobacco use (pancreas, 2.0--4.0; urinary bladder, 3.0) (37). Pancreatic cancer is among the top 10 cancers diagnosed and is the fourth leading cause of cancer death among men and women in the United States (27). Although little is known about the etiology of pancreatic cancer, smoking is the strongest environmental risk factor that has been identified for this cancer (46). Studies also have linked smokeless tobacco use to pancreatic cancer, with N-nitrosamines in these products being the plausible carcinogenic agents (47,48). Nearly all studies have shown that persons who use tobacco products have at least a twofold increased risk of developing pancreatic cancer compared with nonusers (46,47). Obesity, inflammation from pancreatitis, and several genetic syndromes also are associated with increased risk for pancreatic cancer (46). The incidence of pancreatic cancer found in this study remained stable during the study period. This finding is in contrast to findings from a recent study covering 10% of the U.S. population, which found significant decreases in pancreatic cancer during 1973--2002 (49). The difference in trends between these two studies likely is a result of substantial differences in population coverage and differences in the time period studied. Certain studies have suggested that improvements in diagnostic modalities during the last 20 years have greatly improved the accuracy of pancreatic cancer diagnoses (46). These improvements could be related to the stability in incidence rates observed in this study. Urinary bladder cancer is the fourth most commonly diagnosed cancer among men in the United States (27). Among women, this cancer is far less common, ranking tenth among white women and lower among women of other races (27). The decrease in bladder cancer incidence rates reported in this study among men and women is consistent with findings from other studies. Longer-term trend analyses using SEER data alone suggest that this decrease began recently for men but has been occurring for several decades among women (29). Among persons who smoke, the risk of developing bladder cancer increases with lifetime duration of smoking and number of cigarettes smoked per day and decreases among former smokers (50,51). Results of a case-control study in Europe suggest that after cessation of smoking, the risk of bladder cancer decreases by approximately 40% within 1--4 years (50). AML and esophageal, kidney, stomach, and cervical cancers have similar relative risks associated with tobacco use (1.5--2.5) (37). Esophageal cancer is not as commonly diagnosed in the United States as certain other cancers discussed in this report; however, esophageal cancer is one of the top 10 leading causes of cancer death among most racial and ethnic populations (27). Smoking is more strongly associated with squamous cell carcinoma of the esophagus than adenocarcinoma of the esophagus (52). Several studies have indicated that smokers have a twofold to threefold increase in risk for developing esophageal adenocarcinoma; however, esophageal adenocarcinoma risk remains elevated after cessation of tobacco use, and this risk might persist for 30 years (53). The relatively greater percentages of adenocarcinoma among men in this study might be related to this persistently elevated risk, and decreases in the incidence of this histologic type might take longer to be observed. The lack of a decrease in esophageal cancer incidence might also be related to this persistently elevated risk but could be related to trends in alcohol use and obesity, which are also established risk factors (52). Kidney cancer is a frequently diagnosed cancer among both men and women in the United States (27). Risk factors for kidney cancer are not well understood. For both men and women, kidney cancer risk was found to increase with duration of lifetime smoking and number of cigarettes smoked per day and to decrease among former smokers (54). In addition to smoking, obesity and hypertension are emerging as risk factors for kidney cancer (55). For both men and women, kidney cancer rates increased during the study period. These findings are similar to those from a study of long-term SEER data, which found that this increase has been evident for both men and women during the past several decades (29) and might be a result of the prevalence of obesity (56). Certain studies also suggest that the increase in kidney cancer rates might be a result of increased detection of kidney cancer through the increased use of ultrasound and computed tomography for non--cancer-related conditions (57). Stomach cancer is common among certain racial and ethnic populations in the United States (27). Tobacco use is related to both cardia and noncardia stomach cancer; the association with noncardia adenocarcinoma is stronger (58). Risk is related to number of cigarettes smoked per day and lifetime duration of smoking, and the risk decreases by approximately 30% among former smokers (59). In addition to tobacco use, the major risk factors for stomach cancer include a diet of salted foods and smoked meat and chronic infection with Helicobacter pylori (60), which was determined to be a carcinogen by IARC in 1994 (61). H. pylori plays a much larger role in stomach cancer etiology in areas of the world where the prevalence of infection is higher, especially in Asian countries, which have 70% of cases of stomach cancer worldwide (60). Several studies have reported that racial and ethnic populations other than whites have higher prevalences of H. pylori infection (62,63). These findings are consistent with the results of this study, which found higher stomach cancer incidence rates in these populations. Persons who smoke are more likely to develop persistent infections with H. pylori and less likely to respond to antibiotic treatment for the infection (64). The finding in this study that stomach cancer incidence has been decreasing in recent years is consistent with findings of other studies that have demonstrated decreases during the last several decades (29) and might be a result of increases in consumption of fresh fruits and vegetables, decreases in the consumption of salt-preserved food, and decreases in the prevalence of H. pylori infection. Although the overall incidence of cervical cancer is low in the United States, black and Hispanic women continue to have a higher incidence of this cancer than white women (27). Smoking consistently has been associated with higher risks of cervical cancer, and this risk increases with the lifetime duration of smoking and number of cigarettes smoked per day (65). Carcinogenic chemicals consistent with tobacco use have been found in cervical mucous (66), as have changes in DNA (i.e., formation of adducts) (67). Although tobacco use is related to cervical cancer, the primary risk factor is human papillomavirus (HPV) infection, which is a sexually transmitted disease. HPV infection likely accounts for the lower peak age (40--49 years) of incidence of cervical cancer in this report, as well as the high rate among Hispanic women (68). Smoking and HPV might also act synergistically in the occurrence of cervical cancer. Recent studies show consistently that smoking is associated with an increased risk for developing cervical cancer among HPV-positive women (69). The increased risk is moderate (odds ratio = 2.17; CI = 1.46--3.22) and is not likely to be a result of confounding by varying sexual behaviors (59), because all women were HPV-positive in these analyses. The decrease in cervical cancer rates is likely a result of continued screening, which identifies premalignant lesions that are removed before a malignancy occurs (29). AML is a relatively rare cancer in the United States (27). Current cigarette smoking is an established risk factor for AML; in populations with a high prevalence of smoking, 20% of AML cancers are attributable to tobacco use among current smokers (70). Smoking is thought to increase risk through exposure to benzene, an environmental agent consistently associated with AML, and other carcinogens found in tobacco. AML incidence was highest among white men and women, and Vermont had the highest incidence rate among men in 2004, findings that are inconsistent with smoking patterns. This lends support to the multiple factors involved in AML etiology, which is related to race and ethnicity, environmental exposures, and genetic risk factors that have not yet been determined. Several recent reports have implicated obesity as an emerging risk factor for AML (71). The detailed cancer incidence data in this report provide a baseline measurement that can be used in future monitoring of cancer incidence trends. As more geographically complete incidence data become available for all populations in the United States, researchers might be able to further describe patterns of cancer incidence that are specifically related to tobacco use, similar to studies of mortality disparities (72). This will ensure that any reductions in the incidence of tobacco-related cancers are maintained and disparities in incidence are identified. LimitationsThe findings in this report are subject to at least three limitations. First, information about smoking status and other risk factors for cancer (e.g., obesity or HPV) is not available in cancer registry data. Therefore, although the overall incidence of tobacco-related cancers in the United States is presented, the association between the development of these cancers and tobacco and other etiologic could not be determined. Second, data for AI/ANs have been shown to be considerably underreported in cancer registries (73). Linkage with external sources of information such as IHS administration records improved the quality of AI/AN data in this study (29); however, because IHS only serves federally recognized tribes, these data might not fully represent all AI/ANs, especially those in state-recognized tribes. Finally, although this study covered >90% of the U.S. population and is the most inclusive study of the U.S. population, high-quality incidence data were not available from Maryland, Mississippi, North Dakota, South Dakota, Tennessee, and Virginia for the study period. Public Health ActionIn 2007, the Institute of Medicine (IOM) presented a blueprint for action to "reduce smoking so substantially that it is no longer a public health problem for our nation" (74). The two-pronged strategy for achieving this goal included not only strengthening and fully implementing proven tobacco control measures but also changing the regulatory landscape to permit policy innovations. The primary IOM recommendation is that each state should fund a comprehensive tobacco control program at the level recommended by CDC (74,75). CDC recommends that states establish and sustain tobacco control programs that contain the following components: state and community interventions, health communication interventions, cessation interventions, surveillance and evaluation, and administration and management (75). Best Practices for Comprehensive Tobacco Control Programs --- 2007 is an evidence-based guide designed to help states plan and establish effective tobacco control programs to prevent and reduce tobacco use (75). Each state is provided a recommendation for the annual investment necessary to prevent initiation of tobacco use, promote cessation among those already using tobacco, eliminate exposure to secondhand smoke, and eliminate tobacco-use--related disparities, such as differences in patterns of use, cessation, morbidity, exposure, and access to resources (75). Additional support for tobacco control comes from CDC's National Comprehensive Cancer Control Program, which provides financial support and advice to aid states in developing and implementing cancer control plans. Comprehensive cancer control is based on the premise that effective cancer control planning and program implementation at the local, state, and national levels address a continuum of services, including primary prevention and early detection, quality cancer treatment, and addressing the needs of cancer survivors (76). A recent assessment concluded that nearly one half of 39 published plans addressed tobacco control; however, plans varied widely and can be improved (76). States that have made tobacco control a priority have benefited from this commitment. For example, California, which has the longest-running comprehensive tobacco control program in the United States, reduced adult smoking prevalence from 22.7% in 1998 to 13.3% in 2006 (77). The incidence of lung cancer has decreased nearly four times more quickly in California than in the rest of the United States, which likely is partly a result of program-related reductions in smoking (78,79), and during 1987--1997, an estimated 11,000 cases of lung cancer were prevented (80). Additional states such as Florida (81), Maine, New York, and Washington (82--84) also have been successful in reducing smoking among adults and youths. Cancer incidence in these and other states should continue to be monitored at the local, state, and national levels to measure the impact of these public health successes in reducing the effects of tobacco use. Ongoing cancer incidence reporting is essential to help identify types of cancers, in addition to those reported in this study, that might also be causally related to tobacco use. In 2004, the Surgeon General concluded that evidence was suggestive but not sufficient to infer a causal relationship between smoking and colorectal adenomatous polyps and colorectal cancer (17). Several more recently published studies have provided additional data implying a potential causal relationship (85--87); however, the relationship might be stronger for rectal than colon cancer (86). Current and former smoking should be considered a potential risk factor for colorectal cancer in clinical and public health settings, and future research should focus on evaluating the association between smoking and colorectal cancer risk. The Surgeon General also concluded that the evidence is suggestive but not sufficient to infer a causal relationship between smoking and liver cancer (17); however, IARC review concluded that the data were sufficient to infer a causal relationship (20). Although substantial epidemiologic evidence suggests a relationship between smoking and liver cancer, the 2004 Surgeon General report review determined that important questions remain regarding the impact of hepatitis infection and alcohol use on the relationship between smoking and liver cancer (17). The strength of an association between cigarette smoking and liver cancer varies according to hepatitis B virus (HBV) infection status, with stronger associations among persons who are not infected with HBV. Additional research is needed to establish the possible association between smoking and liver cancer, with further consideration of the history of hepatitis infection and other confounding factors such as alcohol use. Breast cancer risk related to tobacco smoke exposure also has been recognized (17,89,90). However, the 2006 Surgeon General report The Health Consequences of Involuntary Exposure to Tobacco Smoke concludes that the evidence is suggestive but not sufficient to infer a causal relationship between secondhand smoke and breast cancer (88). The 2004 IARC publication Tobacco Smoke and Involuntary Smoking concluded that active smoking is not associated with an increased risk for breast cancer in studies that compare active smokers with persons who have never smoked (20). However, the lack of evidence for an increase in breast cancer risk among active, female smokers does not exclude the possibility that certain subgroups of female smokers might be at increased risk because of genetic or other factors. Additional research and evaluation of data are needed to help determine whether a causal relationship exists between smoking and certain cancers such as colorectal, liver, and breast cancer. If the evidence indicates that these cancers, and perhaps other types, are associated with smoking, the incidence of cancer attributed to smoking in the United States might rise substantially. Ongoing surveillance and reporting are essential to monitor cancer incidence trends, identify populations at greatest risk for developing tobacco-related cancers, and evaluate the effectiveness of targeted tobacco control programs and policies.
* Localized: cancer that is confined to the primary site; regional: cancer that has spread directly beyond the primary site or to regional lymph nodes; distant: cancer that has spread to other organs.
References
Table 1  Return to top. Figure 1 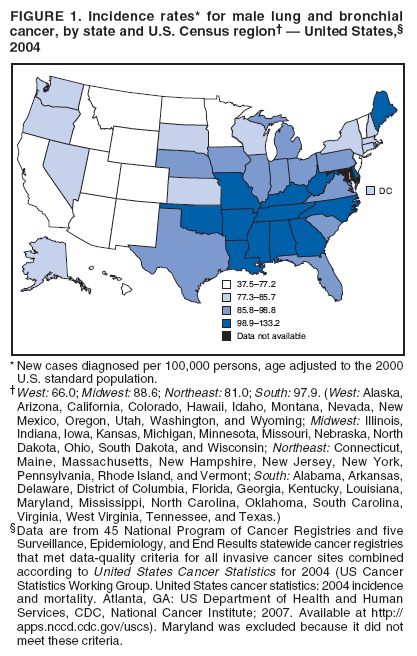 Return to top. Table 2  Return to top. Figure 2 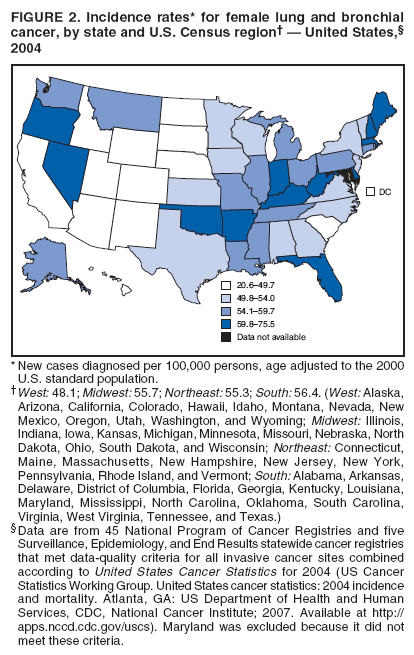 Return to top. Table 3  Return to top. Figure 3 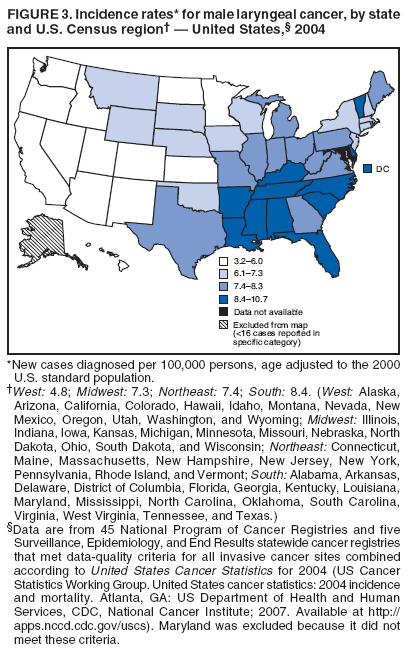 Return to top. Table 4  Return to top. Figure 4 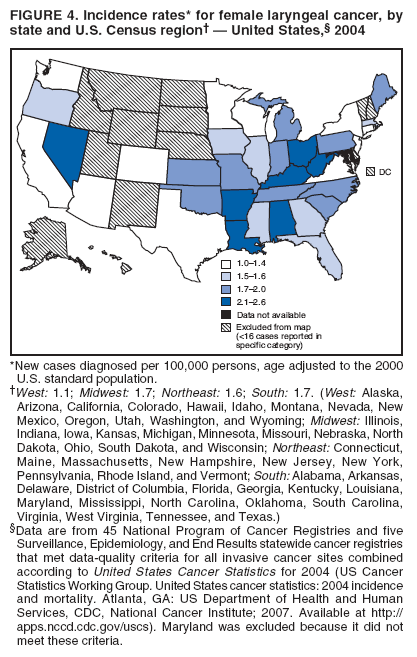 Return to top. Table 5  Return to top. Figure 5 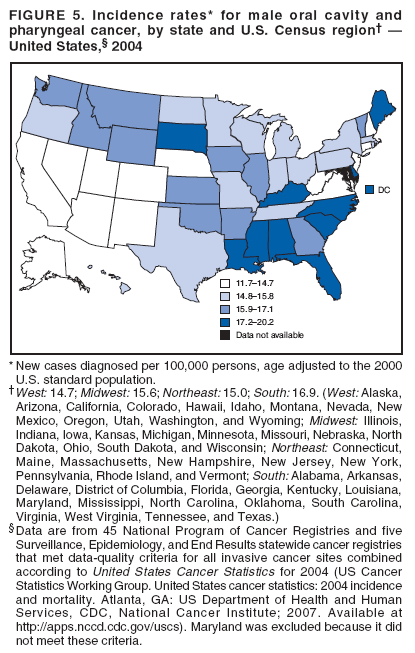 Return to top. Table 6  Return to top. Figure 6 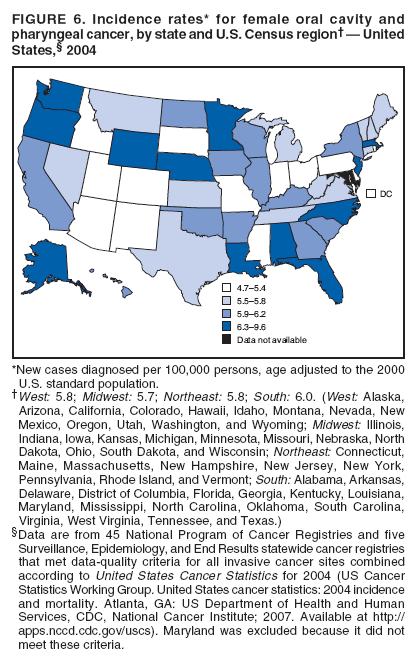 Return to top. Table 7  Return to top. Figure 7 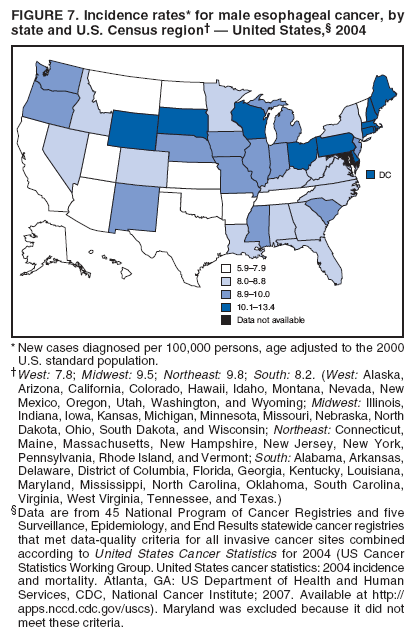 Return to top. Table 8  Return to top. Figure 8 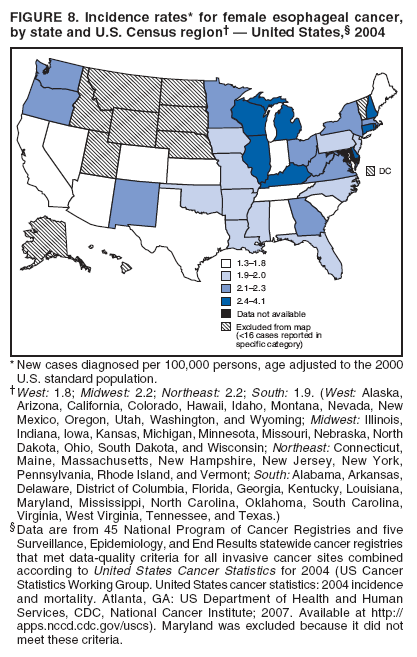 Return to top. Table 9  Return to top. Figure 9 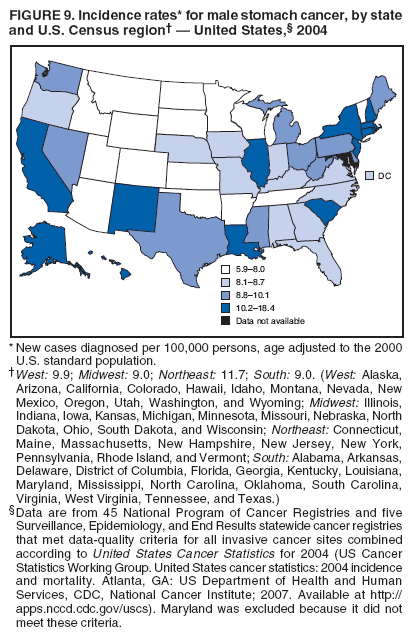 Return to top. Table 10  Return to top. Figure 10 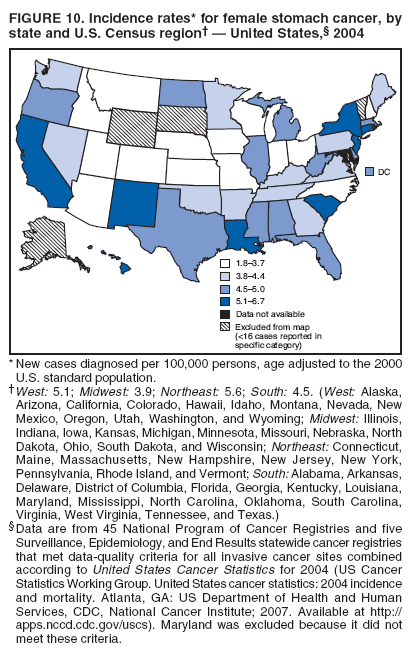 Return to top. Table 11  Return to top. Figure 11 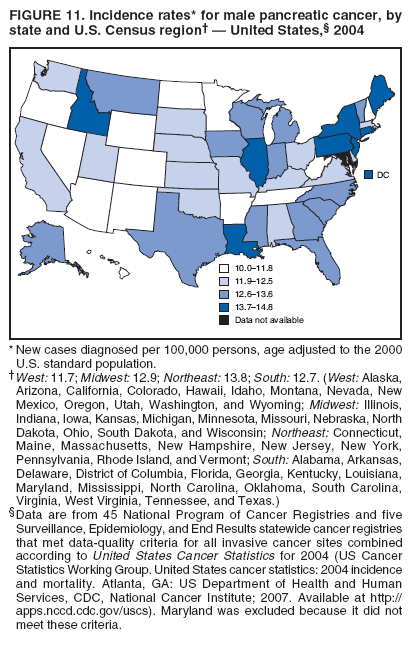 Return to top. Table 12  Return to top. Figure 12 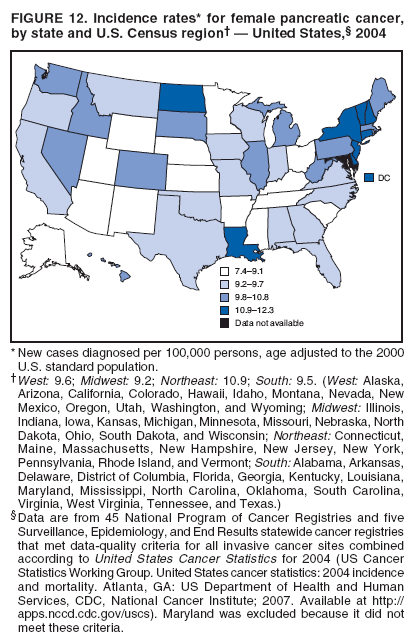 Return to top. Figure 13 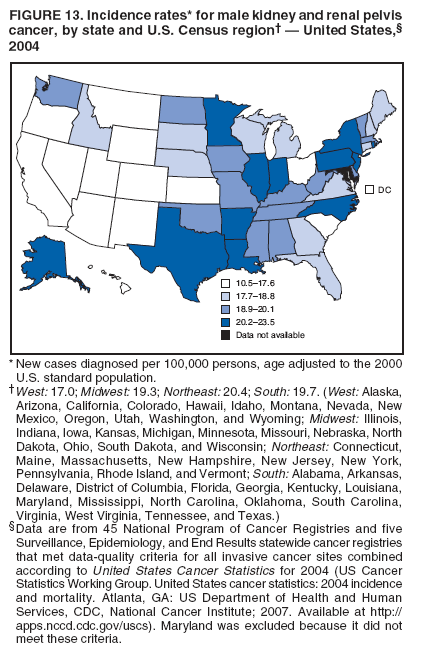 Return to top. Figure 14 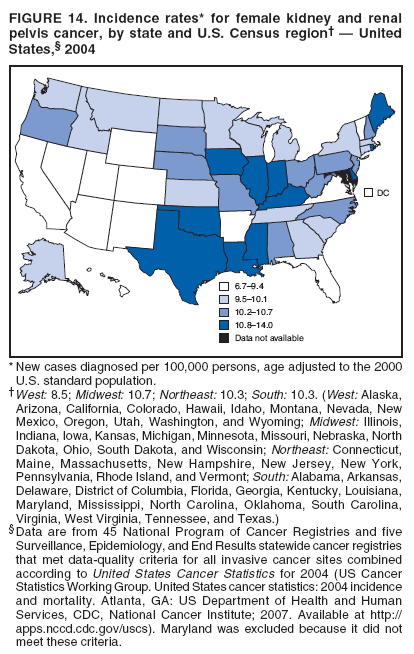 Return to top. Figure 15 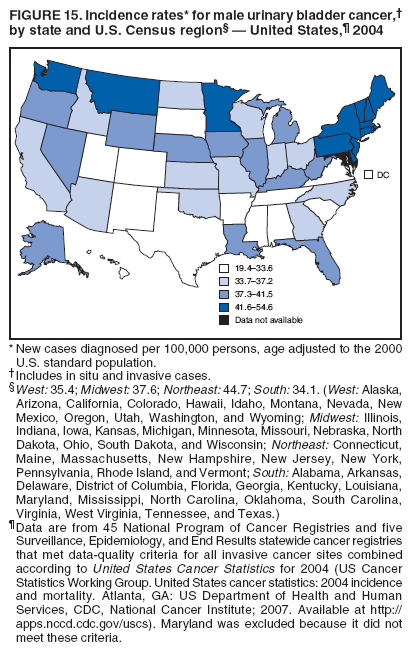 Return to top. Figure 16 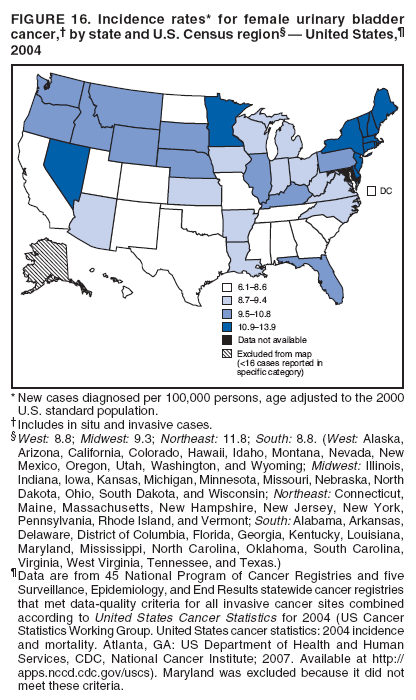 Return to top. Figure 17 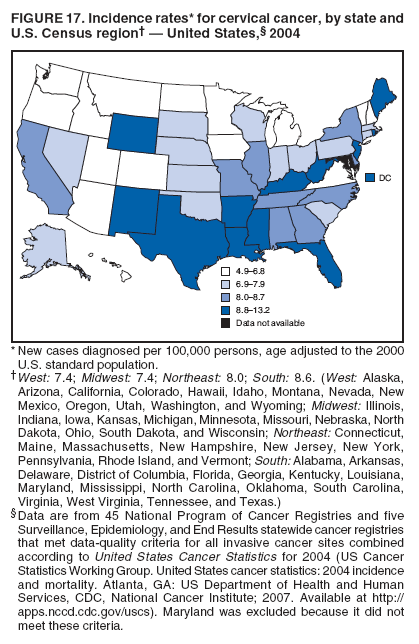 Return to top. Figure 18 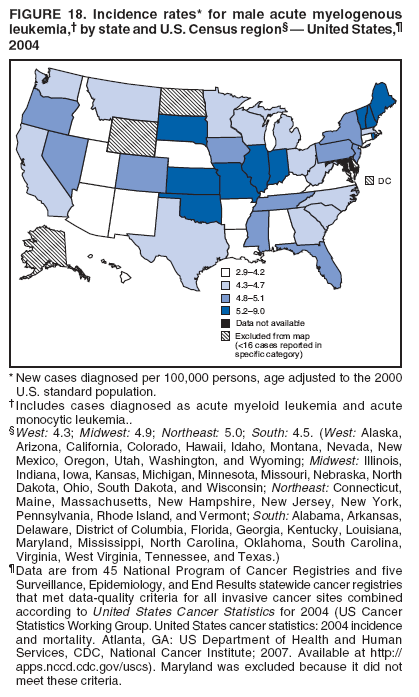 Return to top. Figure 19 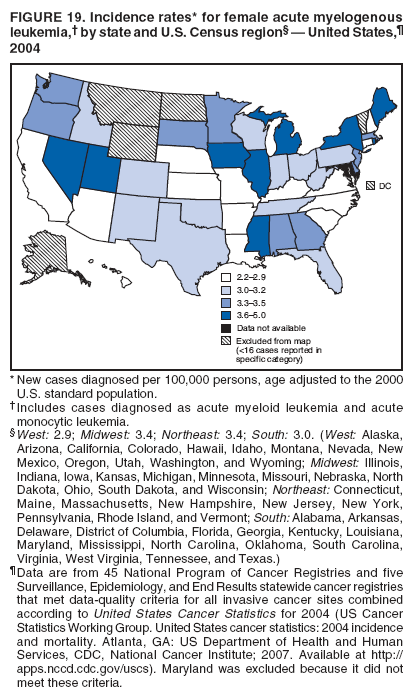 Return to top.
All MMWR HTML versions of articles are electronic conversions from typeset documents. This conversion might result in character translation or format errors in the HTML version. Users are referred to the electronic PDF version (http://www.cdc.gov/mmwr) and/or the original MMWR paper copy for printable versions of official text, figures, and tables. An original paper copy of this issue can be obtained from the Superintendent of Documents, U.S. Government Printing Office (GPO), Washington, DC 20402-9371; telephone: (202) 512-1800. Contact GPO for current prices. **Questions or messages regarding errors in formatting should be addressed to mmwrq@cdc.gov.Date last reviewed: 8/22/2008 |
|||||||||
|