 |
|
|
|
|
|
|
| ||||||||||
|
|
|
|
|
|
|
||||
| ||||||||||
|
|
|
|
|
|
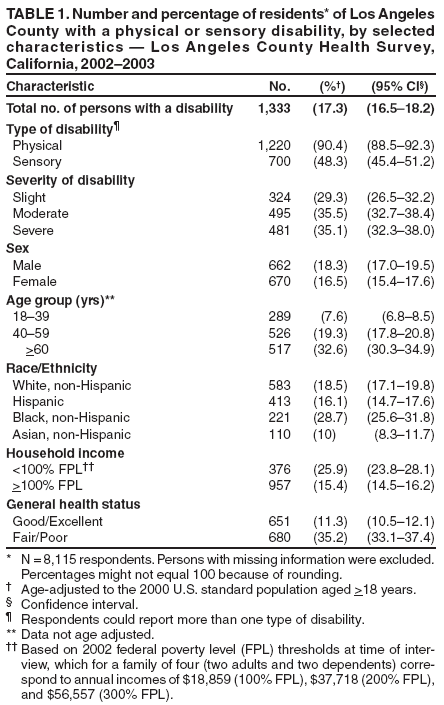
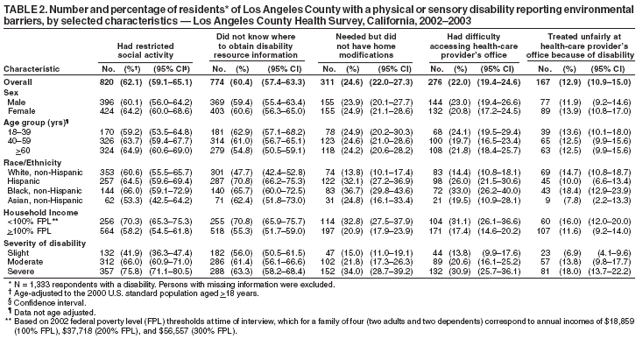
Persons using assistive technology might not be able to fully access information in this file. For assistance, please send e-mail to: mmwrq@cdc.gov. Type 508 Accommodation and the title of the report in the subject line of e-mail. Environmental Barriers to Health Care Among Persons with Disabilities --- Los Angeles County, California, 2002--2003In 2002, an estimated 51.2 million persons in the United States (approximately 18.1% of the population) had a disability (1). Recent data suggest that substantial disparities in health behaviors and overall health status exist between persons with and without disabilities (2). Nonetheless, when they have access to adequate health care, persons with disabilities can lead healthy lives (3,4). The World Health Organization's International Classification of Functioning, Disability, and Health stresses the importance of environment (e.g., physical environment, attitudes of others, or policies) as either a barrier or facilitator in the daily activities of persons with disabilities (5). In addition, increasing access to health and wellness treatment programs for persons with disabilities and reducing the proportion of persons with disabilities who report environmental barriers to participation in daily activities are goals of Healthy People 2010 (objectives 6-10 and 6-12). However, few population-based studies have explored how environment affects the lives of those with disabilities. To determine the prevalence of disability among persons in Los Angeles County, California, and assess the effects of environmental barriers on these persons, residents were surveyed during 2002--2003. The results of that survey suggested that persons with physical or sensory disabilities experienced several environmental barriers and that the prevalence of barriers varied by demographic characteristics, household income, and severity of disability. To improve quality of life among persons with disabilities, public and private health agencies should implement measures to remove environmental barriers to health care and other services. The Los Angeles County Health Survey is a biennial, random-digit--dialed telephone survey of the adult, noninstitutionalized population of Los Angeles County (6). Adults aged >18 years were surveyed during October 2002--February 2003, and interviews were conducted in several languages (i.e., English, Spanish, and four Asian languages). Of the 14,154 eligible adults contacted, 8,167 (57.7%) completed the interview. Persons were classified as having a disability if they answered "yes" to at least one of the following questions regarding any long-term impairment that lasted or was expected to last for at least 3 months: 1) "Are you limited in any way in any activities because of a physical, mental, or emotional problem?" 2) "Do you now have any health problems that require you to use special equipment such as a cane, a wheelchair, a special bed, or a special telephone?" and 3) "Do you consider yourself a person with a disability?" Persons who were classified as having a disability were then asked questions to determine whether their disability was physical, sensory, mental, or learning; respondents could report more than one type of disability. Respondents also were asked whether their disability was slight, moderate, or severe; definitions for severity level were not provided and were based on respondent perception. This analysis was restricted to those who reported physical or sensory disabilities. Respondents were asked, "Which of the following best describes your disability?" Those who indicated that they experienced one or both of the following limitations were classified as having a physical disability: 1) a lack of mobility (e.g., walking or going upstairs) or 2) a limitation in body movement, such as standing, sitting, crouching, or bending or difficulty gripping, holding, or manipulating small objects or carrying light loads. Respondents who indicated that they experienced one or both of the following limitations were classified as having a sensory disability: 1) difficulty hearing (except for loud noises) or 2) difficulty seeing, including difficulty reading newspaper print. The survey also assessed the prevalence of the following five environmental barriers related to disability: 1) experiencing restricted social activity, 2) not knowing where to obtain disability resource information, 3) needing home modifications but not having them, 4) having difficulty accessing a health-care provider's office because of its physical layout or location, and 5) being treated unfairly at a health-care provider's office. To determine the prevalence of these barriers, participants were asked the following questions: 1) "Do you agree with the statement `I don't participate in as many social activities as I would like because of my disability?'" 2) "Do you know where to get information about community resources for people with disabilities?" 3) "Could you benefit from, but do not have, special modifications or adaptive equipment in your home?" 4) "Does the location or layout of your health-care provider's office keep you from getting needed care?" and 5) "Have you been treated unfairly by a health-care provider or the provider's staff because of a disability?" Data were weighted to reflect the sex, age, and racial/ethnic distribution of the county population on the basis of 2002 projections from the U.S. Census Bureau. Results were stratified by sex, age, race/ethnicity, household income, self-reported general health status, type of disability, and severity of disability. Results were age adjusted to the 2000 U.S. population aged >18 years. Overall, 1,333 (17.3%) of 8,115 respondents in Los Angeles County reported having a physical or sensory disability, a percentage consistent with national estimates (7--9). The prevalence of disability was highest among those aged >60 years, non-Hispanic blacks, and men, with 517 (32.6%), 221 (28.7%), and 662 (18.3%) reporting disabilities, respectively. Among the 1,333 reporting physical or sensory disabilities, 1,220 (90.4%) reported a physical disability, and 700 (48.3%) reported a sensory disability; 587 (44%) reported both a physical and sensory disability. A total of 495 (35.5%) respondents reported having moderate disabilities, 481 (35.1%) reported severe disabilities, and 324 (29.3%) reported slight disabilities (Table 1). Among persons with a physical or sensory disability, 1,123 (84.7%) reported environmental barriers related to their disability. A total of 820 (62.1%) reported that their disability restricted social activity; 256 (70.3%) persons with lower incomes, 144 (66.0%) blacks, and 257 (64.5%) Hispanics reported this barrier. Overall, 774 (60.4%) respondents did not know where to obtain disability resource information. Those who were aged 18--39 years, were not white (i.e., black, Hispanic, or Asian), or had lower incomes were most likely to report difficulty acquiring disability resource information (Table 2). A total of 311 (24.6%) persons with physical or sensory disabilities reported needing home modifications but not having them. Among those who needed home modifications, 114 (32.8%) had incomes below the 100% federal poverty level (FPL), which is an annual salary of $18,859 for a family of four (with two adults and two dependents). Of those with disabilities, 122 (32.1%) Hispanics and 83 (36.7%) blacks did not have needed modifications, compared with 74 (13.8%) whites (Table 2). Twenty-two percent of persons with disabilities reported difficulty accessing a health-care provider's office because of the physical layout or location of the property. Prevalence was highest for blacks (276 [33.0%]) and those with lower incomes (104 [31.1%]). Difficulty accessing a provider's office increased with severity of disability. Approximately 167 (12.9%) reported unfair treatment at a provider's office because of a disability; prevalence of reported unfair treatment increased with severity of disability and lower income (Table 2). Reported by: E Bancroft, MD, A Lightstone, MPH, P Simon, MD, Los Angeles County Dept of Health Svcs. J Crews, DPA, National Center on Birth Defects and Developmental Disabilities; E Baraban, PhD, EIS Officer, CDC. Editorial Note:These findings highlight the need for environmental improvements to reduce social isolation and facilitate activities of daily living among persons with disabilities. The results also underscore the need for public health practitioners, health-care providers, and community organizations to take a proactive role in removing environmental barriers. For example, social isolation might be decreased by ensuring that social venues such as movie theaters, restaurants, and stores are following the Americans With Disabilities Act building accessibility standards and by providing reliable, community-based transportation to such venues. To increase access to information, public health practitioners might compile lists of community-related disability resource information and distribute them to local health-care centers and physicians' offices. Accessibility to offices of health-care providers could be improved by lowering service counters and examination tables and ensuring that scales are wheelchair accessible. Treatment by health-care providers could be improved by educating providers about ways to make appointments run more smoothly. For example, providers should sit down when addressing a person in a wheelchair, speak directly to the patient (rather than to a spouse or friend) when providing information, clearly enunciate when addressing a person with a hearing loss, and schedule extra appointment time for persons who might take longer to dress or get up and down from the examination table (because of a physical disability) or take longer to provide information (because of a sensory disability). In addition, researchers should consider including disability and environmental questions in other population-based surveys to assess the unmet needs of persons with disabilities. Taking these steps will help address certain CDC Health Protection Goals (priority areas for research, investment, and evaluation), one of which is achieving the best possible quality of life by increasing the number of adults who are able to participate fully in life activities (10). The results of this study are subject to at least three limitations. First, the true prevalence of persons with disabilities might be underestimated because 42% of those contacted did not participate. In addition, the survey did not include residents of assisted-living facilities or nursing homes. Second, after stratifying the data, certain results might be statistically unreliable because of small sample sizes. Finally, because of the diversity and large geographic area and population size of Los Angeles County (i.e., approximately 4,000 square miles and 10.2 million residents), the results might not be generalizable to smaller or more homogenous populations. The results indicate that 84.7% of persons with disabilities reported environmental barriers, including social isolation, trouble obtaining resource information, difficulty accessing needed health care because of the office layout or location of a health-care provider, and unfair treatment by a health-care provider. These results indicate the need for health-care providers and public health officials to address such concerns, in the community and the home, to improve overall health and quality of life and reduce the disparities that exist between persons with and without disabilities. References
Table 1  Return to top. Table 2  Return to top.
Disclaimer All MMWR HTML versions of articles are electronic conversions from ASCII text into HTML. This conversion may have resulted in character translation or format errors in the HTML version. Users should not rely on this HTML document, but are referred to the electronic PDF version and/or the original MMWR paper copy for the official text, figures, and tables. An original paper copy of this issue can be obtained from the Superintendent of Documents, U.S. Government Printing Office (GPO), Washington, DC 20402-9371; telephone: (202) 512-1800. Contact GPO for current prices. **Questions or messages regarding errors in formatting should be addressed to mmwrq@cdc.gov.Date last reviewed: 12/6/2006 |
|
|||||||
|