 |
|
|
|
|
|
|
| ||||||||||
|
|
|
|
|
|
|
||||
| ||||||||||
|
|
|
|
|
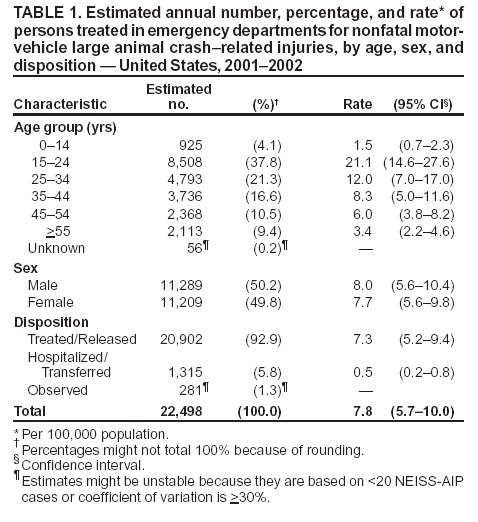
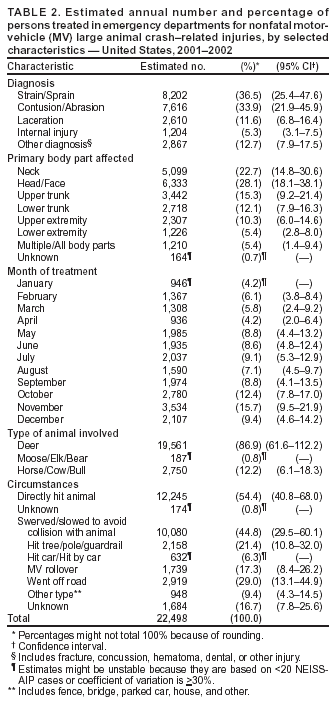
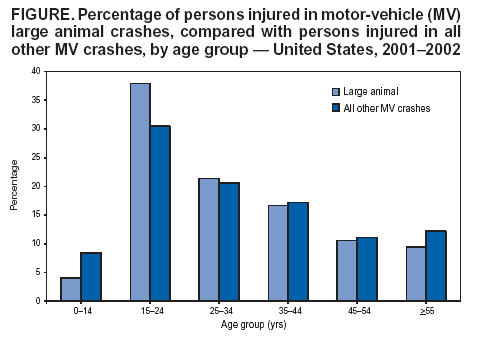
Persons using assistive technology might not be able to fully access information in this file. For assistance, please send e-mail to: mmwrq@cdc.gov. Type 508 Accommodation and the title of the report in the subject line of e-mail. Nonfatal Motor-Vehicle Animal Crash--Related Injuries --- United States, 2001--2002In 2000, an estimated 6.1 million light-vehicle (e.g., passenger cars, sport utility vehicles, vans, and pickup trucks) crashes on U.S. roadways were reported to police (1). Of these reported crashes, 247,000 (4.0%) involved incidents in which the motor vehicle (MV) directly hit an animal on the roadway (1). Each year, an estimated 200 human deaths result from crashes involving animals (i.e., deaths from a direct MV animal collision or from a crash in which a driver tried to avoid an animal and ran off the roadway) (2). To characterize nonfatal injuries from these incidents, CDC analyzed data from the National Electronic Injury Surveillance System-All Injury Program (NEISS-AIP). This report summarizes the results of that analysis, which indicated that, during 2001--2002, an estimated 26,647 MV occupants per year were involved in crashes from encounters with animals (predominantly deer) in a roadway and treated for nonfatal injuries in U.S. hospital emergency departments (EDs). Cost-effective measures targeting both drivers (e.g., speed reduction and early warnings) and animals (e.g., fencing and underpasses) are needed to reduce injuries associated with MV collisions involving animals. NEISS-AIP is operated by the Consumer Product Safety Commission and collects data about initial visits for all types and causes of injuries treated in U.S. EDs (3). NEISS-AIP data are drawn from a nationally representative subsample of 66 of 100 NEISS-AIP hospitals selected as a stratified probability sample of hospitals in the United States and its territories with a minimum of six beds and a 24-hour ED. NEISS-AIP provides data on approximately 500,000 injury- and consumer product--related ED cases each year. Data for each case include a comment variable that contains additional information about the circumstances of the injury. Each case was assigned a sample weight on the basis of the inverse probability of selection; these weights were summed to provide national estimates of MV animal crash--related injuries. Confidence intervals (CIs) were calculated by using a direct variance estimation procedure that accounted for the sample weights and complex sample design. Rates were calculated by using 2001 and 2002 U.S. Census bridged-race population estimates from the National Center for Health Statistics (4). Data used in this study were obtained from medical records of 676 ED patients treated for nonfatal injuries incurred while driving or riding in a light vehicle and encountering an animal in the roadway. This report focuses on the majority of these patients, who encountered larger animals (e.g., deer, moose, elk, bear, horses, or cattle) entering the roadway. Smaller animals (e.g., dogs, cats, squirrels, raccoons, and possums) were included only in the overall national estimate. No information was obtained on type of vehicle. MV animal crashes were defined as those involving direct collision with an animal on a roadway or those occurring on or off the roadway as a result of trying to avoid hitting the animal. These cases were identified by using a brief narrative captured in the NEISS-AIP database that described the circumstances of the injury incident. An additional 79 patients injured as motorcyclists involved in MV-animal crashes were excluded from this study. During 2001--2002, an estimated 26,647 (9.3 per 100,000 population; 95% CI = 6.7--11.9) persons were treated annually in U.S. EDs for MV animal crash--related injuries, of which 22,498 (84.8%) were MV occupants in crashes involving larger animals (Table 1). The highest MV large animal crash--related injury rate (21.1 per 100,000 population) occurred among persons aged 15--24 years (Table 1). The age distribution of those injured in MV large animal crashes was different from those injured during all other types of MV traffic-related crashes (p<0.03); most of this difference was attributed to an overrepresentation of persons aged 15--24 years (p<0.0001) and an underrepresentation of children aged 0--14 years (p<0.0001) (Figure). Among injured persons aged 15--24 years, 48.9% were driving the vehicle. The MV large animal crash--related injury rate was similar for males and females (Table 1). Approximately 6% of those treated in U.S. EDs required hospitalization for their injuries. MV large animal crash--related injuries were mostly strains/sprains (36.5%) and contusions/abrasions (33.9%) and involved the head/face (28.1%), neck (22.7%), and upper trunk (15.3%) (Table 2). The majority (94.5%) of the neck injuries were strains and sprains, and 62.5% of head/face injuries were contusions, abrasions, or lacerations. Persons injured during MV large animal crashes were treated more often during October and November than other months. Deer were the most common large animals involved in these incidents (86.9%). Approximately half (54.4%) of these crashes involved a direct collision with the animal, and the remainder (44.8%) resulted from the driver trying to avoid hitting the animal. Of those incidents in which the animal was avoided, the crash most commonly involved an MV leaving the roadway (29.0%); an MV hitting a tree, pole, or guardrail (21.4%); or an MV rollover (17.3%) (Table 2). Reported by: JM Conn, MS, JL Annest, PhD, Office of Statistics and Programming; A Dellinger, PhD, Div of Unintentional Injury Prevention, National Center for Injury Prevention and Control, CDC. Editorial Note:Nationally, nonfatal MV animal crash--related injuries account for <1.0% of approximately three million MV occupants treated in U.S. EDs annually (5). Direct MV animal crashes represent nearly 4.0% of an estimated 6.1 million light-vehicle crashes reported to police in the United States (1). However, in rural areas with large deer populations, MV animal crashes and associated occupant deaths and injuries, wildlife loss, and property damage are important concerns. For instance, in Wisconsin, MV deer crashes accounted for nearly 16% of all statewide police-reported MV crashes in 2002 (6). National estimates reported from this study are consistent with state MV animal crash data reported to police. In this study, the majority of MV occupant injuries resulted from encounters between the MV and deer; however, 12% of those injured resulted from MV crashes involving large domesticated animals (e.g., horses and cattle). MV occupant injuries can occur because of a direct MV collision with the large animal or from swerving or maneuvering to avoid a collision with the animal. In this study, 63.8% of younger drivers swerved to avoid the animal, resulting in an MV crash and subsequent injury. Similar to other MV occupant injuries from crashes that occur on U.S. highways, a majority of the injuries were neck sprains/strains, and contusions/abrasions to the head and face. One fourth of MV animal crash--related injuries were treated in October and November at the height of the fall deer hunting, mating, and migration season (7). MV animal crashes are more likely to occur in the early morning hours and especially at dusk, when deer are actively moving about and likely to cross the road in rural areas (6--8). The findings of this report are subject to at least three limitations. First, although the risk for MV animal crash--related injury can vary among states and local areas, NEISS-AIP is designed to provide only national estimates and does not provide regional, state, or local estimates or estimates by urban and rural categories. Second, because of the small number of cases reported, this study excluded motorcyclists, who are known to be at higher risk for injury in crashes (6). Finally, NEISS-AIP only provides data on injured persons treated in hospital EDs. Prevention efforts have focused on warning signs to alert drivers to animal crossings, speed restrictions, roadway fencing and underpasses/overpasses aimed at directing animals toward safe passage, roadside clearing, roadside mirrors and reflectors (i.e., to deflect headlight beams toward the sides of the road to alert deer), and reduction of deer populations through recreational hunting (7,9). Evaluation studies have been conducted to assess the cost and effectiveness of these methods, but the results are inconsistent (10). Interventions with some supportive evidence (e.g., fences combined with underpasses or overpasses) also are among the most expensive to build and maintain. Primary prevention of MV animal crashes can be accomplished by keeping large animals, especially deer, from entering the roadway or by providing drivers with more time to react to a potentially dangerous situation. The same behaviors that are recommended to help prevent crashes in general are relevant for MV animal crashes. Driving within speed limits, staying alert and reducing distracted and drowsy driving, and eliminating alcohol-impaired driving will give drivers, particularly teenagers and younger adults, more time to react and avoid collisions. Prevention of injury if a crash occurs can be accomplished by the universal use of proper restraints, including safety belts, child safety seats, and booster seats. Acknowledgments This report is based on data contributed by T Schroeder, MS, C Downs, A McDonald, MA, and other staff of the Div of Hazard and Injury Data Systems, Consumer Product Safety Commission. G Ryan, PhD, P Holmgreen, MS, R Thomas, MS, Office of Statistics and Programming, National Center for Injury Prevention and Control, CDC. References
Table 1  Return to top. Table 2  Return to top. Figure  Return to top.
Disclaimer All MMWR HTML versions of articles are electronic conversions from ASCII text into HTML. This conversion may have resulted in character translation or format errors in the HTML version. Users should not rely on this HTML document, but are referred to the electronic PDF version and/or the original MMWR paper copy for the official text, figures, and tables. An original paper copy of this issue can be obtained from the Superintendent of Documents, U.S. Government Printing Office (GPO), Washington, DC 20402-9371; telephone: (202) 512-1800. Contact GPO for current prices. **Questions or messages regarding errors in formatting should be addressed to mmwrq@cdc.gov.Page converted: 8/5/2004 |
|||||||||
This page last reviewed 8/5/2004
|