 |
|
|
|
|
|
|
| ||||||||||
|
|
|
|
|
|
|
||||
| ||||||||||
|
|
|
|
|
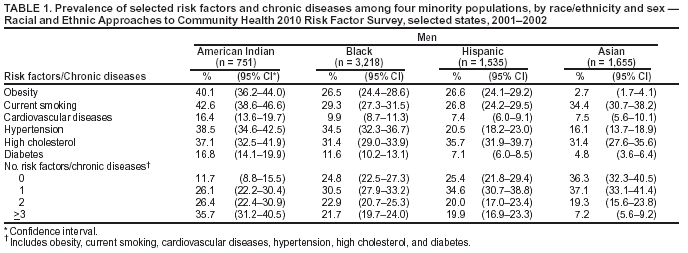
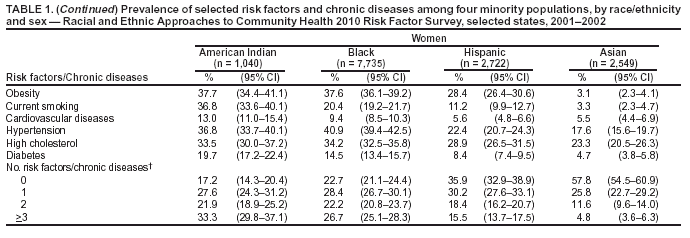
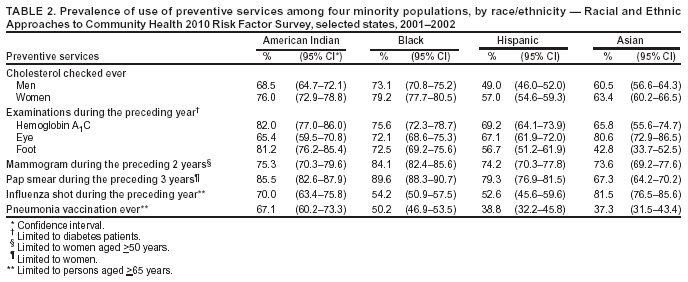
Persons using assistive technology might not be able to fully access information in this file. For assistance, please send e-mail to: mmwrq@cdc.gov. Type 508 Accommodation and the title of the report in the subject line of e-mail. Health Status of American Indians Compared with Other Racial/Ethnic Minority Populations --- Selected States, 2001--2002Despite overall declines in morbidity and mortality in the United States in recent years, a persistent gap in health status remains between American Indians (AIs) and non-Hispanic whites (1,2). This report compares the health status of AIs with that of other racial/ethnic minority populations by using data from a survey conducted during 2001--2002 in 21 communities through the Racial and Ethnic Approaches to Community Health (REACH) 2010 project. The results indicate that although AIs had a higher prevalence of chronic disease risk factors than other racial/ethnic minority populations, they also were more likely to use preventive services. Culturally sensitive primary prevention strategies to reduce risk factors and disease burden in AI communities should be developed and implemented. REACH 2010 is a community-based demonstration project designed to reduce racial/ethnic disparities in health. As a part of the project evaluation, CDC contracted with the National Opinion Research Center at University of Chicago to conduct the REACH 2010 Risk Factor Survey. The baseline survey was conducted during June 2001--August 2002 in 21 minority communities in the United States. Sample designs were customized for each of the 21 communities, taking into account geography, racial/ethnic density, expected telephone coverage, and other factors (e.g., suggestions received from the communities). In the 18 communities in which expected telephone coverage was >80%, interviews were conducted by telephone. Face-to-face interviews were conducted in three communities in which 1) the expected telephone coverage was low or inconclusive or 2) cooperation over the telephone was expected to be difficult. The survey sampled eligible households and interviewed an average of 1,000 minority residents aged >18 years in each community. Uniform screening and interview questionnaires were used for all households and were administered in English, Spanish, Vietnamese, Khmer, or Chinese. The median response rate was 74% (range: 60%--99%). The 21 communities are located in 14 states (Alabama, California, Georgia, Illinois, Louisiana, Massachusetts, Michigan, North Carolina, New York, Oklahoma, South Carolina, Tennessee, Texas, and Washington). The survey included two AI groups, 14 black groups, seven Hispanic groups, and four Asian groups; five communities had multiple ethnic groups. For this report, data for persons of the same race/ethnicity from different communities were aggregated. The presence of a risk factor or chronic condition was based on self-reported data. Obesity was defined as body mass index of >30.0 kg/m2, calculated from self-reported height and weight. Cardiovascular disease was defined as having any of the following conditions: heart attack, coronary heart disease, or stroke. High blood cholesterol was defined as ever being told by a doctor or other health professional that blood cholesterol was high. Women who had diabetes diagnosed only during pregnancy were not considered to have diabetes. Data were weighted to represent the communities surveyed, and SUDAAN was used to account for the complex survey sampling designs. The sample included 1,791 AIs, 10,953 blacks, 4,257 Hispanics, and 4,204 Asians (Table 1). Among both men and women in these four groups, AIs had the highest prevalences of obesity, current smoking, cardiovascular disease, and diabetes. Among men, AIs also had the highest prevalences of self-reported hypertension and high blood cholesterol levels. Among women, blacks had the highest prevalences of these two conditions, and AIs had the second highest prevalences. Approximately 80% of AIs had one or more adverse risk factor or chronic condition, and one third had three or more. A substantial percentage of AIs received preventive services (Table 2). Compared with other minority populations, AIs with diabetes reported the highest percentages of receiving hemoglobin A1C (HbA1C) and foot examinations. AIs aged >65 years reported the highest prevalences of receiving pneumonia vaccination. Overall, AIs had the second highest rates for blood cholesterol screening, mammography, Papanicolaou (Pap) smear, and influenza vaccination. A total of 84% of AIs had received at least one preventive service. Reported by: Y Liao, MD, P Tucker, DrPH, WH Giles, MD, Div of Adult and Community Health, National Center for Chronic Disease Prevention and Health Promotion, CDC. Editorial Note:The findings in this report indicate that AI communities bear a greater burden of health risk factors and chronic disease than other racial/ethnic minority populations. Although earlier investigations reported relatively low rates of hypertension in AIs who do not have diabetes (3), incidence is increasing (4). For the populations surveyed, self-reported hypertension was as common among AIs as it is among blacks. The Strong Heart Study conducted during 1989--1992 reported that fewer AIs had high blood cholesterol levels compared with national samples from the Third National Health and Nutrition Examination Survey (5). However, in the REACH 2010 survey, approximately one third of AIs had high blood cholesterol levels, and prevalence of cardiovascular disease was higher than in other minority populations. Diabetes was uncommon among AIs before World War II, but prevalence has increased sharply during the previous 20 years (6). Approximately half of the adult population in some tribes have diabetes (6). The epidemic of obesity also is a relatively recent phenomenon and is believed to contribute to the rising prevalence of diabetes, hypertension, and heart disease. The age-adjusted death rates for heart diseases and cerebrovascular diseases are lower among AIs than the general U.S. population (2). However, the disproportionate burden of risk factors and disease in AIs likely will increase mortality rates in this population. The findings in this report underscore the importance of primary prevention in AI communities and the need for prevention strategies that emphasize lifestyle modification, including changes in diet, physical activity levels, weight control, and smoking cessation. Because habits often are formed early in life and carried into adulthood, culturally sensitive prevention strategies directed toward children and young adults are needed if increases in obesity, diabetes, and other risk factors among AIs are to be reversed. Results of the REACH 2010 survey indicate that AIs had higher prevalence of self-reported use of certain preventive services than any other minority populations. In 2001, the prevalence of blood cholesterol screening among AIs was approaching national levels (74.9% for men and 79.5% for women in the U.S. general population) (7). Given the high burden of diabetes complications (e.g., eye and kidney disease, cardiovascular disease, and lower extremity amputation) among AIs (6), intensive measures are necessary to prevent these conditions. The REACH 2010 survey indicates that the proportions of AIs with diabetes who have had HbA1C measurements and foot examinations during the preceding year have surpassed national levels (8). For mammography and Pap smears, AIs have reached or are close to reaching the national health objectives for 2010 (i.e., 70% for mammogram during the preceding 2 years and 90% for Pap smear during the preceding 3 years [objectives 3-13 and 3-11b, respectively]) (9). This achievement demonstrates the commitment of AI communities, tribal corporations, public health authorities, and health-care providers. The findings in this report are subject to at least two limitations. First, AIs from different tribal communities and locations exhibit ethnic, cultural, and social diversity. The REACH 2010 survey included only two AI communities and might not represent AIs from other communities. However, the data from this survey are consistent with the general pattern of health status in AIs reported in other studies (4). Second, because estimates are based on self-reported data, the prevalence of some chronic conditions and use of preventive services might be underestimated. However, the questions on the REACH 2010 survey have demonstrated good reliability and validity (10). The REACH 2010 demonstration project is under way in eight AI and Alaska Native communities. Community coalitions have been established, priority target areas have been identified, and several public health education and prevention programs to reduce health risk factors and chronic diseases are being implemented. The findings of the REACH 2010 survey underscore the need for additional, nationwide efforts to eliminate health disparities between AIs and other populations. References
Table 1   Return to top. Table 2  Return to top.
Disclaimer All MMWR HTML versions of articles are electronic conversions from ASCII text into HTML. This conversion may have resulted in character translation or format errors in the HTML version. Users should not rely on this HTML document, but are referred to the electronic PDF version and/or the original MMWR paper copy for the official text, figures, and tables. An original paper copy of this issue can be obtained from the Superintendent of Documents, U.S. Government Printing Office (GPO), Washington, DC 20402-9371; telephone: (202) 512-1800. Contact GPO for current prices. **Questions or messages regarding errors in formatting should be addressed to mmwrq@cdc.gov.Page converted: 11/26/2003 |
|||||||||
This page last reviewed 11/26/2003
|