 |
|
|
|
|
|
|
| ||||||||||
|
|
|
|
|
|
|
||||
| ||||||||||
|
|
|
|
|
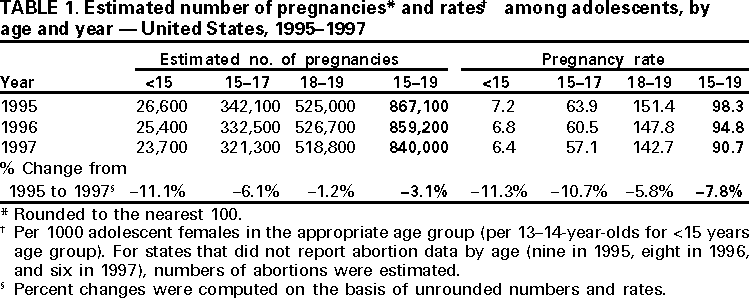
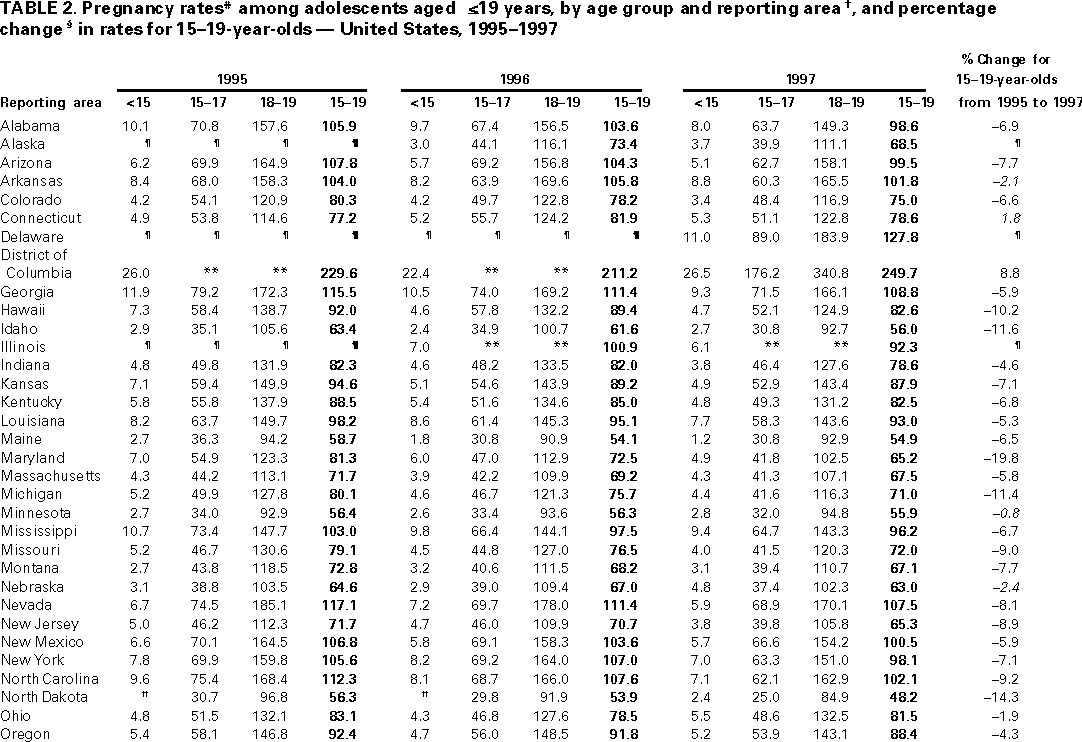
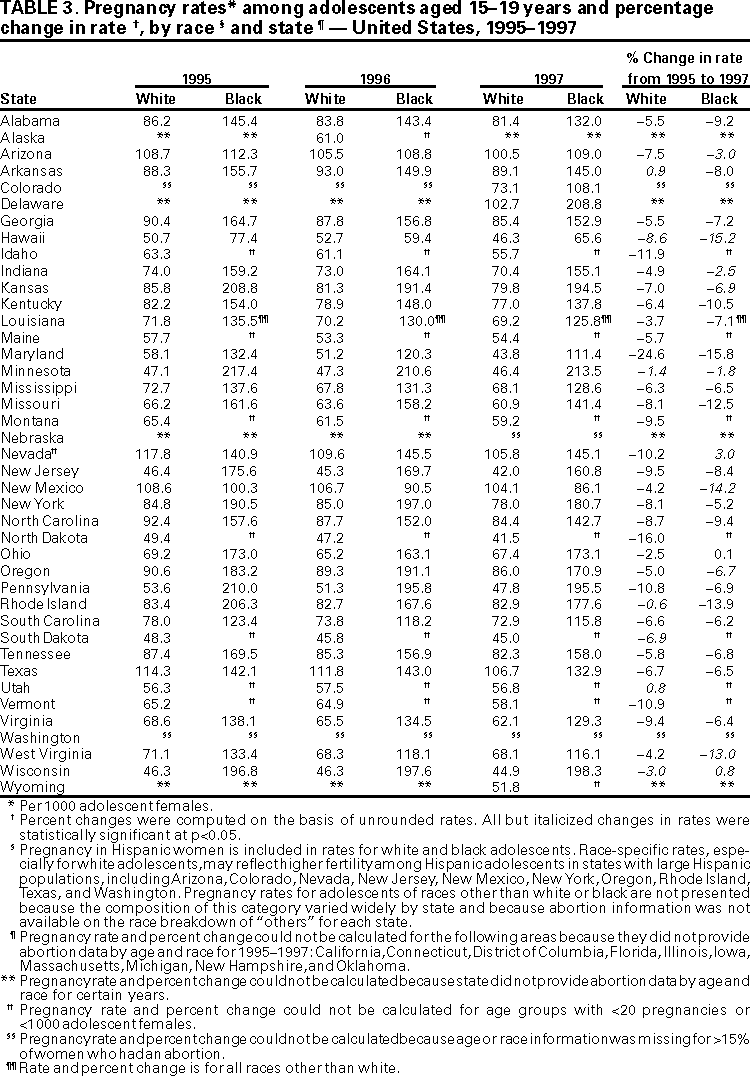
Persons using assistive technology might not be able to fully access information in this file. For assistance, please send e-mail to: mmwrq@cdc.gov. Type 508 Accommodation and the title of the report in the subject line of e-mail. National and State-Specific Pregnancy Rates Among Adolescents --- United States, 1995--1997Please note: An erratum has been published for this article. To view the erratum, please click here. Each year in the United States, 800,000--900,000 adolescents aged <19 years become pregnant. Adolescent pregnancy and childbearing have been associated with adverse health and social consequences for young women and their children. This report presents estimated national numbers of pregnancies and national and state-specific pregnancy rates for adolescents aged <19 years from 1995* to 1997. The findings indicate a decline in national and state-specific adolescent pregnancy rates during 1995--1997, and a continuing downward trend beginning in the early 1990s (1,2,4). Number of pregnancies was estimated as the sum of live births, legally induced abortions, and estimated fetal losses (i.e., spontaneous abortions and stillbirths) among females aged <19 years. Live birth data were reported by the mother's state of residence. Because abortion data by residence were not available for all states, abortions were reported by state of occurrence. Complete age-specific abortion information was not available for nine reporting areas in 1995 (including the District of Columbia [DC]), eight areas in 1996 (including DC), and six states in 1997. To calculate national adolescent pregnancy rates, estimates of abortions among adolescents were calculated for states with missing data (1). Estimates of fetal losses were based on sample survey data of women aged 15--44 years from the 1988 and 1995 National Surveys of Family Growth (NSFG) (3). A national estimate of fetal losses for all females aged 15--19 years was derived from NSFG data and used to create annual estimates of fetal losses based on the number of live births and legally induced abortions in a given year (CDC, unpublished data, 1998). Denominators (estimates of the adolescent female population by state, age, and race) for abortion and fetal loss rates were obtained from postcensal population estimates.§ Published birth rates were added to abortion and fetal loss rates and were based on earlier, slightly different¶ population estimates (5). Rates were calculated as the number of pregnancies per 1000 females aged 15--17, 18--19, or 15--19 years. Because most pregnancies, births, and abortions (97% of live births and 94% of legally induced abortions) among females aged <15 years occurred among 13--14-year-olds (CDC, unpublished data, 2000; 6), this age group was used as the denominator for calculating rates for females aged <15 years. Legally induced abortions for which mother's age or race was unknown were included in categories based on the distribution of mothers with known age or race. Although abortion totals were available for all states, age-specific data adequate to calculate pregnancy** rates were available from 42 states and DC for 1995, 44 states and DC in 1996, and 45 states and DC in 1997. Because adequate age and Hispanic ethnicity data for females who had abortions were available for 24 states in 1995 (7), 23 states in 1996, and 26 states in 1997, pregnancy rates by ethnicity were not included; some states with missing Hispanic ethnicity data had large Hispanic populations. From 1995 to 1997, among females aged 15--19 years, the national number of pregnancies declined by 3.1% and the national pregnancy rate declined by 7.8%, from 98.3 per 1000 in 1995 to 90.7 in 1997 (Table 1). During 1995--1997, the pregnancy rate declined by 11.3% among females aged <15 years, by 10.7% among females aged 15--17 years, and by 5.8% among females aged 18--19 years. For each year, the pregnancy rate for 18--19-year-olds was approximately 2.5 times that of 15--17-year-olds, and the rate for females aged <15 years was approximately one ninth that of 15--17-year-olds. State-specific pregnancy rates per 1000 among 15--19-year-olds ranged from 56.3 (North Dakota) to 117.1 (Nevada) in 1995; from 53.9 (North Dakota) to 114.1 (Texas) in 1996; and from 48.2 (North Dakota) to 127.8 (Delaware) in 1997 (Table 2). In each year, the rate for each reporting area was highest for females aged 18--19 years and lowest for females aged <15 years. From 1995 to 1997, the pregnancy rate for 15--19-year-olds decreased in 40 of the 43 reporting areas for which age-specific data were available. Statistically significant declines occurred in 34 states and ranged from 1.9% (Ohio) to 19.8% (Maryland); no state showed a significant increase. During 1995--1997, significant declines in the pregnancy rate occurred among females aged <15 years in 20 of 41 reporting areas with available data, among 15--17-year-olds in 35 of 42 reporting areas, and among 18--19-year-olds in 27 of 42 reporting areas. Pregnancy rates for 15--19-year-olds were, in every state except one, higher for blacks than for whites among the 30 states with available data for both groups (Table 3). Significant declines in the pregnancy rate occurred among whites in 29 of the 35 states for which adequate data for whites were available, and in 17 of 28 states for which adequate data for blacks were available. No significant increases in pregnancy rates were found for adolescents of either race in states with available data. Among females aged 15--19 years, the national birth rate decreased from 56.8 in 1995 to 52.3 in 1997 (5), with declines occurring in most reporting areas. The national number of abortions declined 2.7% from 1995 to 1997, and the national abortion rate decreased 7.4%, from 26.6 per 1000 in 1995 to 24.6 in 1997. During this period, the abortion rate decreased 3.9% among females aged <15 years (from 2.8 to 2.7), 10.1% among females aged 15--17 years (from 18.2 to 16.3), and 5.4% among females aged 18--19 years (from 39.6 to 37.5). From 1995 to 1997, the abortion rate for 15--19-year-olds decreased in 32 of the 43 reporting areas for which age-specific data were available. In 25 of the 31 areas where both birth and abortion rates decreased, the percent decrease in abortion rates exceeded the decline in birth rates. Reported by: Behavioral Epidemiology and Demographic Research Br and Statistics and Computer Resources Br, Div of Reproductive Health, National Center for Chronic Disease Prevention and Health Promotion, CDC. Editorial Note:The estimation of national and state-specific adolescent pregnancy and abortion rates was limited by the lack of age-specific abortion and adequate race-specific abortion data for some states. The lack of adequate age-specific abortion data by Hispanic ethnicity in at least half of states for the 3 years also limited this analysis because separate rates for Hispanic and non-Hispanic adolescents could not be computed. State-by-state comparisons of pregnancy rates for whites for states with large Hispanic populations should be interpreted with caution. Moreover, use of abortion data by occurrence rather than by state of residence may have inflated the abortion rate in areas with large metropolitan areas that might draw from adjoining states (e.g., Delaware, DC, and Kansas). Legally induced abortions reported to CDC may undercount the true number of these abortions (1). Estimates of fetal losses based on NSFG survey data are subject to underreporting because of unrecognized early fetal losses; for females aged <20 years, fetal loss estimates are based on small numbers of pregnancies. Therefore, pregnancy totals based on births, legally induced abortions reported to CDC, and fetal loss estimates may underestimate the actual pregnancy rate. However, underreporting likely remains relatively constant from year to year and is therefore unlikely to affect the trends shown in this report. Sexual experience, sexual activity, and effective contraceptive use are important determinants of changes in pregnancy rates. The decline in pregnancy rates among females aged 15--19 years have been attributed to stable rates of sexual experience and activity among this group and increased use of condoms (4,8). Increased use of long-acting hormonal methods introduced in the early 1990s also has been associated with the decline (9). Sustaining the downward trend in adolescent pregnancy will require addressing complex individual and community-level factors that can affect adolescents' sexual and reproductive behavior. Community- and school-based programs designed to reduce adolescent pregnancy that address risk factors and specific skills to postpone sexual experience and increase contraceptive use may be more effective in reducing adolescent pregnancy than programs focusing exclusively on changing sexual beliefs or behavior (10). Effective programs also include strong educational components, messages targeting different groups of adolescents, and youth development approaches that will strengthen self-esteem and planning for the future (10). Scientific evaluation of adolescent pregnancy prevention measures is an essential component of these community-based programs. The identification of effective strategies will assist state and local agencies in implementing successful approaches to continuing the downward trend in adolescent pregnancy. References
* National and state-specific adolescent pregnancy rates for 1995 were previously reported (1,2). National rates for 1995 are reported here because fetal loss estimates were not included in the earlier definition of pregnancy (1) and because of a change in the population denominator data supplied by the Bureau of the Census used in calculating rates; state-specific data for 1995 are reported again because of the change in the population denominator data. Adolescent pregnancy rates previously published by CDC (2) should not be used together with those reported here in time series analyses because of these changes in methods. Adolescent pregnancy rates in other sources (3) may not be comparable to data in this report because of different calculation methodologies. For 48 reporting areas in 1995--1996 and 49 in 1997, the number and characteristics of persons who had legal induced abortions were provided by state health departments and the health departments of New York City and the District of Columbia. For four areas in 1995--1996 and three in 1997, the number of abortions were provided from hospitals and other medical facilities. § Available on the World-Wide Web at http://www.census.gov/population/estimates/state/5age9890.txt. Accessed July 2000. ¶ Birth rates for females aged <15 years were calculated using 13--14-year-olds as the denominator. ** Pregnancy rates were excluded if they were based on <20 pregnancies or <1000 adolescents in a particular category, or if >15% of the pregnancies were in women of unknown age or race. District of Columbia is not included in these comparisons because its pregnancy rates were higher than for any state, in part because of large numbers of abortions among nonresidents. Table 1  Return to top. Table 2   Return to top. Table 3  Return to top. Disclaimer All MMWR HTML versions of articles are electronic conversions from ASCII text into HTML. This conversion may have resulted in character translation or format errors in the HTML version. Users should not rely on this HTML document, but are referred to the electronic PDF version and/or the original MMWR paper copy for the official text, figures, and tables. An original paper copy of this issue can be obtained from the Superintendent of Documents, U.S. Government Printing Office (GPO), Washington, DC 20402-9371; telephone: (202) 512-1800. Contact GPO for current prices. **Questions or messages regarding errors in formatting should be addressed to mmwrq@cdc.gov.Page converted: 7/13/2000 |
|||||||||
This page last reviewed 5/2/01
|