Public Water Systems
 The United States is fortunate to have one of the safest public drinking water supplies in the world.
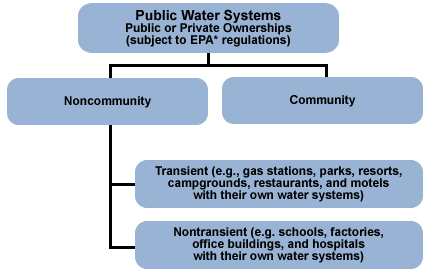
According to the United States Environmental Protection Agency (EPA), public drinking water systems consist of community and non-community systems.
- A community water system (CWS) supplies water to the same population year-round. It serves at least 25 people at their primary residences or at least 15 residences that are primary residences (for example, municipalities, mobile home park, sub-divisions).
- Non-community water systems are composed of transient and non-transient water systems.
- Transient non-community water systems (TNCWS) provide water to 25 or more people for at least 60 days/year, but not to the same people and not on a regular basis (for example, gas stations, campgrounds).
- Non-transient non-community water systems (NTNCWS) regularly supply water to at least 25 of the same people at least six month per year, but not year-round (for example, schools, factories, office buildings, and hospitals which have their own water systems).
The EPA is responsible for the nation's drinking water regulation. To learn more, visit the EPA's Public Drinking Water Systems page.
Public Water Systems Fast Facts
- Of the approximately 155,693 public water systems in the United States, 52,110 (33.5%) are community systems and 103,583 (66.5%) are noncommunity systems, including 84,744 transient systems and 18,839 nontransient systems 1.
- Over 286 million Americans get their tap water from a community water system 1.
- 8% of U.S. community water systems provide water to 82% of the U.S. population through large municipal water systems 1.
- Although the majority of community water systems (78%) are supplied by ground water, more people (68%) are supplied year-round by community water systems that use surface water 1.
- EPA. Factoids: drinking water and ground water statistics for 2007. March 2008, April 2008.
*1971-2010; Ordered from highest to lowest frequency (i.e., #1 is the most-commonly reported etiology). Calculations include etiologic agents from outbreaks with multiple etiologies. Excludes outbreaks with known contamination at point of use (Deficiency 11A, etc.), unless non-POU outbreak deficiencies were also listed. Does not include historic legionellosis outbreaks reported in the 2007-2008 data summary due to missing drinking water system information.
- Page last reviewed: April 7, 2014
- Page last updated: April 7, 2014
- Content source:


 ShareCompartir