CHAPTER 13 TABLES
This website is archived for historical purposes and is no longer being maintained or updated.
Genetics and Public Health in the 21st Century
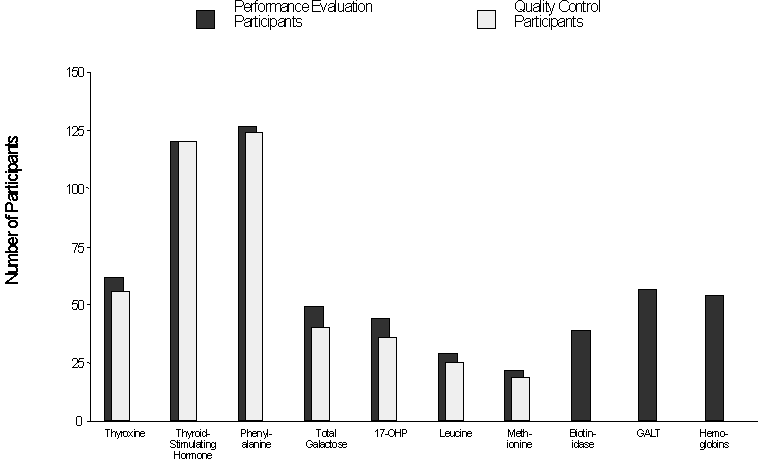
Figure 1. The estimated number of participants for components of the quality assurance program in 1998.

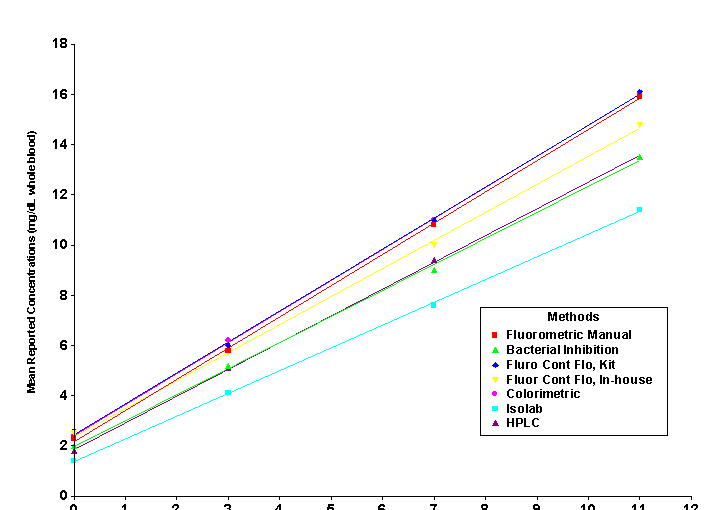
Enriched Concentrations (mg/dL whole blood)
[A text description of this chart is also available.]
Figure 2. Comparison of mean reported concentrations by method for phenylalanine quality control materials.

[A text description of this chart is also available.]
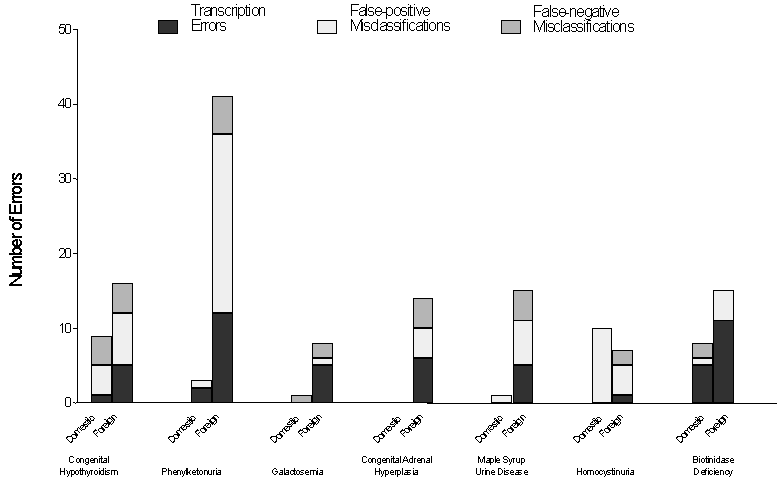
Figure 3. The summary of performance evaluation errors by domestic and foreign laboratories in 1998.

[A text description of this chart is also available.]
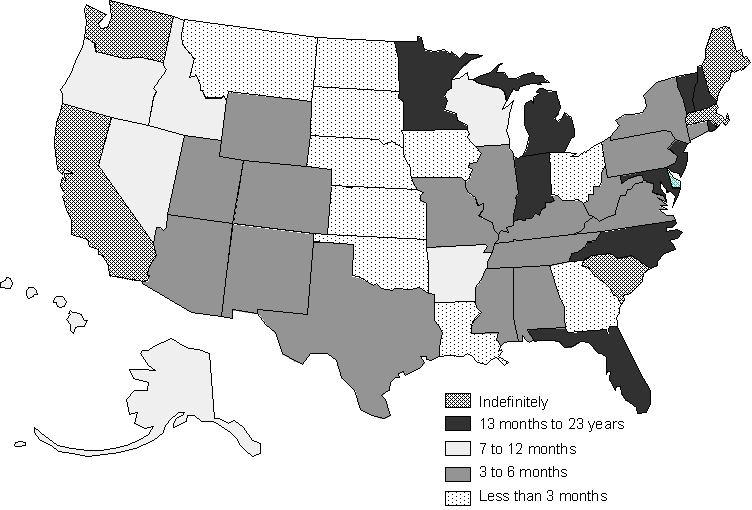
Figure 4. The length of time that leftover newborn screening dried-blood-spot specimens are kept by state screening programs.

[A text description of this chart is also available.]
- Page last reviewed: January 1, 2009 (archived document)
- Content source:


 ShareCompartir
